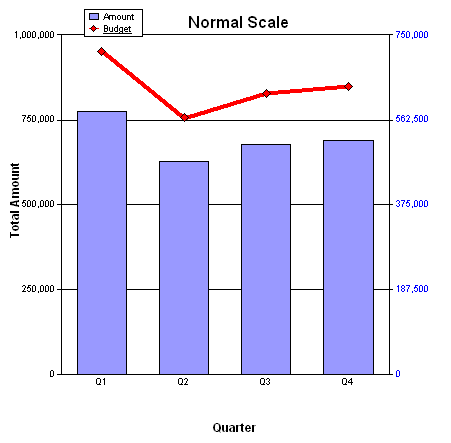
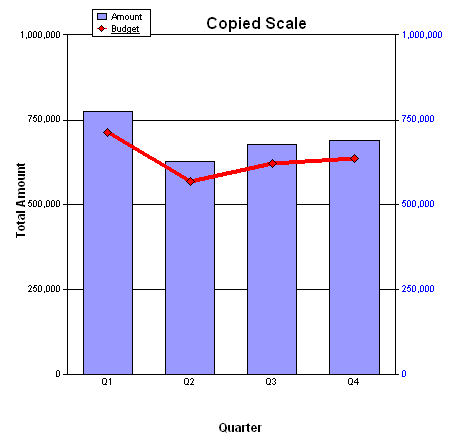
The default behavior in Interactive Reporting Studio is to independently calculate bar and line chart axes (left and right). However, a misleading view of the data can result. In dashboards configured with the Copy Scale component, this feature can be applied to a chart so that the scales on the axes are identical. The result is a more accurate representation of the data.
Figure 11, Bar and Line Chart Displays Default Behavior displays a chart that is not configured with the Copy Scale component, and Figure 12, Copy Scale Component Applied to Chart displays a chart with the Copy Scale feature applied.

