In This Section:
Working With a Simple Report Script
Understanding How Report Writer Works
Considering Security and Multiple-User Issues
All report script examples in this chapter are based on the Sample.Basic database.
When you combine report commands that include page, row, and column dimension declarations with selected members, you have all the elements of a simple report script.
The following step-by-step example of the report script process includes a sample script that specifies these elements, dimensions, and member selection commands. It includes comments, which document the behavior of the script, and the ! output command. This script is based on the Sample.Basic database.
See “Creating Scripts” in the Oracle Essbase Administration Services Online Help.
Type the following information in the report script.
// This is a simple report script example
// Define the dimensions to list on the current page, as below
<PAGE (Market, Measures)

// Define the dimensions to list across the page, as below
<COLUMN (Year, Scenario)

// Define the dimensions to list down the page, as below
<ROW (Product)

// Select the members to include in the report
Sales
<ICHILDREN Market
Qtr1 Qtr2
Actual Budget Variance
<ICHILDREN Product

// Finish with a bang
!
See “Saving Scripts” in the Oracle Essbase Administration Services Online Help.
See “Executing Report Scripts” in the Oracle Essbase Administration Services Online Help.
When you execute the example script against the Sample.Basic database, it produces the following report:
                                    East Sales

                        Qtr1                          Qtr2
             Actual    Budget  Variance    Actual    Budget  Variance
           ========  ========  ========  ========  ========  ========
100           9,211     6,500     2,711    10,069     6,900     3,169
200           6,542     3,700     2,842     6,697     3,700     2,997
300           6,483     4,500     1,983     6,956     5,200     1,756
400           4,725     2,800      ,925     4,956     3,200     1,756
  Product    26,961    17,500     9,461    28,678    19,000     9,678

                                    West Sales

                        Qtr1                          Qtr2
             Actual    Budget  Variance    Actual    Budget  Variance
           ========  ========  ========  ========  ========  ========
100           7,660     5,900     1,760     7,942     6,500     1,442
200           8,278     6,100     2,178     8,524     6,200     2,324
300           8,599     6,800     1,799     9,583     7,600     1,983
400           8,403     5,200     3,203     8,888     6,300     2,588
  Product    32,940    24,000     8,940    34,937    26,600     8,337

                                    South Sales

                        Qtr1                          Qtr2
             Actual    Budget  Variance    Actual    Budget  Variance
           ========  ========  ========  ========  ========  ========
100           5,940     4,100     1,840     6,294     4,900     1,394
200           5,354     3,400     1,954     5,535     4,000     1,535
300           4,639     4,000       639     4,570     3,800       770
400        #MISSING   MISSING  #MISSING  #MISSING  #MISSING  #MISSING
  Product    15,933    11,500     4,433    16,399    12,700     3,699

                                    Central Sales

                        Qtr1                          Qtr2
             Actual    Budget  Variance    Actual    Budget  Variance
           ========  ========  ========  ========  ========  ========
100           9,246      ,500     2,746     9,974     7,300     2,674
200           7,269     6,800       469     7,440     7,000       440
300          10,405     6,200     4,205    10,784     6,800     3,984
400          10,664     5,200     5,464    11,201     5,800     5,401
  Product    37,584    24,700    12,884    39,399    26,900    12,499

                                    Market Sales

                        Qtr1                       Qtr2
             Actual    Budget  Variance    Actual    Budget  Variance
           ========  ========  ========  ========  ========  ========
100          32,057    23,000     9,057    34,279    25,600     8,679
200          27,443    20,000     7,443    28,196    20,900     7,296
300          30,126    21,500     8,626    31,893    23,400     8,493
400          23,792    13,200    10,592    25,045    15,300     9,745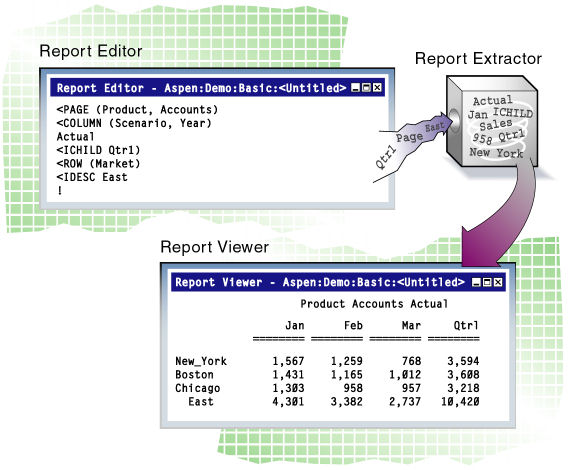
Product 113,418 77,700 35,718 119,413 85,200 34,21Report Writer comprises three main components:
Report Script Editor is a text editor that you use to write report scripts. Report commands define formatted reports, export data subsets from a database, and produce free-form reports. Execute the saved script to generate a report. Saved report scripts have the file extension .rep.
Report Extractor retrieves data information from the Essbase database when you run a report script.
Report Viewer displays the complete report. Saved reports have the file extension .rpt.
 The Report Extractor processes the report script and retrieves data, performing the following actions:
Composes the member list, based on all possible member combinations. For example, <IDESCENDANTS East retrieves member East and all of its descendants.
Applies member restrictions. For example, <LINK refines the member selection.
Orders the member output. For example, <SORT determines the order in which members are sorted.
Restricts data. For example, the following command suppresses the display of all rows that contain only missing values:
{SUPMISSINGROWS}Sorts data. For example, <TOP returns rows with the greatest values of a specified data column.
Formats output. For example, {SKIP} skips one or more lines in the final output report.
The order in which Report Extractor retrieves data affects the execution of complex extraction and formatting commands. For example, because the Report Extractor restricts data (step 5) before sorting data (step 6), if you place conditional retrieval commands in the wrong order, report output results can be unexpected. Be aware of the data retrieval process when designing report scripts.
Understanding the parts of a report is essential as you plan and design your own reports.
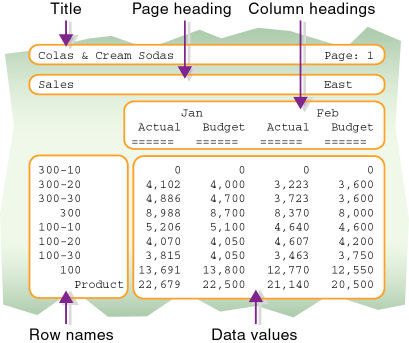
A typical report is composed of the following parts:
Page Headings list dimensions represented on the current page. All data values on the page have the dimensions in the page heading as a common property.
<PAGE (Market, Measures)
Column Headings list members across a page. You can define columns that report on data from multiple dimensions, which results in nested column headings.
<COLUMN (Year, Scenario)
Row Headings list members down a page. You can define a member list that includes rows from multiple levels within a dimension or from multiple dimensions. The rows are indented below the dimension name.
<ROW (Product)
Titles contain user-defined text, date and time stamp, the user name of the person running the report, page numbers, the name of the source database, or any other descriptive information. Titles are user-generated and optional. Page, column, and row headings are automatically generated, because they are necessary to clearly describe the data on the report page.
{ STARTHEADING
TEXT   1 "Prepared by:"
      14 "*USERNAME"
       C "The Electronics Club"
      65 "*PAGESTRING"
TEXT  65 "*DATE"
SKIP
ENDHEADING }
Data values are the values contained in the database cells; they are the lookup results of member combinations or the results of calculations when the report is run through the Report Extractor. Each data value is the combination of the members in the page heading, column heading, and row name.
All data values in a row share the properties of the row names of that row. A report can have zero or more row name dimensions, each of which produces column of row names, with the innermost row name column cycling the fastest.
A report script comprises a series of Report Writer commands, terminated by the bang (!) report output command.
You can enter one or more report scripts in a report script file, which is a text file that you create with Report Script Editor or any text editor.
To build a report script, enter or select commands that define the layout, member selection, and format in Report Script Editor. The different elements of a script are color-coded to aid readability. You can enable syntax autocompletion to help build scripts quickly.
The commands in Report Writer perform two functions, data extraction and formatting:
Extraction commands deal with the selection, orientation, grouping, and ordering of raw data extracted from the database. These commands begin with less-than signs (<).
Formatting commands allow customization of the report format and appearance, the creation of new columns, and calculation of columns and rows. These commands are generally contained within braces ({ }), although some begin with less-than signs (<).
The bang character (!) terminates a series of commands and requests information from the database. You can place one or more report scripts, each terminated by its own ! command, in the same report file.
For information about report commands, see the Oracle Essbase Technical Reference.
Report design is important to presenting information. Include the proper elements and arrange information in an attractive, easy-to-read layout.
To plan a report:
Consider the reporting needs and the time required to generate the report.
Review the sketch; it is often apparent at this stage if additional data or formatting is needed.
Determine ways to optimize the report runtime.
See Optimizing Reports and Other Types of Retrieval for a comprehensive discussion of how to optimize a report script.
You must use Administration Services to use Report Script Editor to create or modify a report script. You can also use any text editor to create script files. If you use Report Script Editor, it enables you to create and modify report scripts stored on your desktop machine, as well as the Essbase Server. To modify report scripts stored on the server, you must have Application Manager or Database Manager access.
Essbase supports concurrent, multiple-user database access. As in most multiple-user environments, Essbase protects critical data with a security system. Users can read or update data only with the correct permissions.
When you execute a report script, Essbase security verifies that you have read or higher access level to all data members specified in the report. In a filtering process identical to that for retrieving members into a spreadsheet, Essbase filters any member from the output for which you have insufficient permissions.
To users who are only reporting data, locks placed by other users are transparent. Even if a user has locked and is updating part of the data required by the report, the lock does not interfere with the report in any way. The data in the report reflects the data in the database at the time you run the report. Running the same report later reflects any changes made after the last report ran.
See User Management and Security in EPM System Security Mode for a comprehensive discussion of the Essbase security system.
This section describes the process for creating a report script.
You can report on the data in a database using the following methods:
Report Script Editor. Use Report Script Editor to create large-scale reports comprising many pages of multidimensional data. Reports of this scale often can exceed the capabilities of even the most robust spreadsheet. Report Writer commands let you define formatted reports, export data subsets from an Essbase database, and produce free-form reports. See “Creating Scripts” in the Oracle Essbase Administration Services Online Help.
Through a spreadsheet. Use report commands in a spreadsheet in free-form mode or template-retrieval mode. See the Oracle Essbase Spreadsheet Add-in User's Guide.
Essbase APIs. See Generating Reports Using the C, Visual Basic, and Grid APIs and see the Oracle Essbase API Reference.
For information about creating and editing report scripts in Administration Services, see “About Report Script Editor” in the Oracle Essbase Administration Services Online Help.
You can save a report script in the following locations:
Report scripts have a .rep extension by default. If you run a report script from Administration Services, the script must have a .rep extension.
When you execute a report script using Administration Services, you can send the results to the Report Viewer window, to a printer, and/or to a file. From the Report Viewer window, you can print, save, and copy the report.
Using Administration Services, you can execute a report in the background so that you can continue working as the report processes. You can then check the status of the background process to see when the report has completed.
See “Executing Report Scripts” in the Oracle Essbase Administration Services Online Help.
You can copy report scripts to applications and databases on any Essbase Server, according to your permissions. You can also copy scripts across servers as part of application migration.
Free-form reports are often easier to create than structured reports. The free-form reporting style is ideal for ad hoc reporting in the Report Script Editor window.
A free-form report does not include PAGE, COLUMN, or ROW commands and instead gathers this information from a series of internal rules that are applied to the report script by the Report Extractor when you run the report.
The following example script and report illustrate free-form reporting:
Sales Colas
Jan Feb Mar
Actual Budget
Illinois
Ohio
Wisconsin
Missouri
Iowa
Colorado
{UCHARACTERS}
Central
! Sales 100
Jan Feb Mar
Actual Budget Actual Budget Actual Budget
======= ======= ======= ======= ======= =======
Illinois 829 700 898 700 932 700
Ohio 430 300 397 300 380 300
Wisconsin 490 300 518 400 535 400
Missouri 472 300 470 300 462 300
Iowa 161 0 162 0 162 0
Colorado 643 500 665 500 640 500
======== === === === === === ===
Central 3,025 2,100 3,110 2,200 3,111 2,200You can use formatting commands to add specific formats to a free-form report. When PAGE, COLUMN, and ROW commands are omitted, Essbase formats free-form reports according to the following rules:
The Report Extractor finds the last member or members of a single dimension defined in the report specification (before the report output operator !). This dimension becomes the ROW dimension for the report. All remaining selections become PAGE or COLUMN dimensions, as defined by rules 2 and 3.
The Report Extractor searches for any single-member selections. If a single member is found that does not satisfy rule 1, that dimension becomes a PAGE dimension.
The Report Extractor searches for all remaining dimension members that do not satisfy rules 1 or 2. If any remaining members are found, those dimensions become COLUMN dimensions. COLUMN dimensions are nested in the order of selection in the free-form script.
The Report Extractor searches the database outline for any dimensions not specified in the report specification. If unspecified dimensions are found, they become PAGE dimensions (the default for single-member selections, as defined in rule 2).
A subsequent selection of one or more consecutive members from a given dimension overrides any previous selection for that dimension.
For example, the following report recognizes California, Oregon, Washington, Utah, Nevada, and West as members of Market.
Sales
Jan Feb Mar
Actual Budget
Apr May Jun
California
Oregon
Washington
Utah
Nevada
{UCHARACTERS}
West
    !
Report Extractor applies free-form formatting rules to this report:
Because California, Oregon, Washington, Utah, Nevada, and West are listed last, the Report Extractor treats them as if ROW (Market) had been specified (rule 1).
Sales is a single-member selection from dimension Measures. The Report Extractor treats this member as if PAGE (Measures) had been specified (rule 2).
After searching the remaining members, the Report Extractor finds members of dimensions Year and Scenario, which it treats as COLUMN (Year, Scenario) (rule 3).
The Report Extractor searches the database outline and finds that dimension Product is not specified in the report specification. Because Product is a single-member selection, the Report Extractor treats this member as if PAGE (Product) had been specified (rule 4).
Finally, the Report Extractor finds that Apr May Jun is from the same dimension as Jan Feb Mar and is displayed on a subsequent line of the script. The Report Extractor discards the first specification (Jan Feb Mar) and uses the second (Apr May Jun).
                                Product Sales

                        Actual                  Budget
                 Apr     May     Jun     Apr     May     Jun
             =======  ======  ======  ======  ======  ======
California     3,814   4,031   4,319   3,000   3,400   3,700
Oregon         1,736   1,688   1,675   1,100   1,000   1,100
Washington     1,868   1,908   1,924   1,500   1,600   1,700
Utah           1,449   1,416   1,445     900     800     800
Nevada         2,442   2,541   2,681   1,900   2,000   2,100
======         =====   =====  =====    =====   =====   =====
  West        11,309  11,584  12,044   8,400   8,800   9,400