Using Spreadsheet Add-in, you can access detail-level drill-through reports that are based on the member intersections of Essbase data cells in the sheet.
Each drill-through report is predefined by an administrator at your organization; that is, each drill-through report is set up to retrieve columns from the relational source and to sort and filter data in these columns. Using the Drill-Through Wizard, you can customize these predefined drill-through reports to retrieve and display only the data that you want.
To access the predefined drill-through report, double-click a drill-through cell in the spreadsheet (or select a range of cells and select Essbase and then Linked Objects). You can set styles for cells tagged as “drill-through” to help identify which cells in the sheet are associated with drill-through reports.
When you double-click a drill-through cell, Essbase displays the Linked Objects Browser dialog box, which displays a drill-through report entry. One cell can be associated with multiple reports. The Linked Objects Browser dialog box also displays entries for linked partitions and other linked object types, such as cell notes, URLs, and application files.
After you view or customize the drill-through report, Integration Services retrieves data from the relational source and displays the results in a spreadsheet.
Before starting the tutorial, ensure that you meet these requirements:
You must install these components on your computer:
The Essbase system administrator must install the Essbase Server.
You must have access toIntegration Services and to an instance of Essbase Server. Contact the Essbase system administrator or the person who administers Integration Services at your organization.
You must have access to the underlying relational database (typically using a user name and password that differ from those that you use for Essbase). To obtain access, contact the Essbase system administrator or the person who administers Integration Services at your organization.
Ensure that the Essdt.xls sample drill-through report spreadsheet is available in EPM_ORACLE_HOME/products/Essbase/EssbaseClient/client/sample.
To use the Essdt.xls sample drill-through report spreadsheet, log on to a computer with Essbase Server and Integration Services installed. You must perform a member and data load and calculate the data for the sample Essbase database that you access from Spreadsheet Add-in.
The sample database containing the drill-through report must be running. The sample drill-through reports used in this tutorial (called “Market Detail,” “Measures Detail,” and “Product Detail”) are available with the sample spreadsheet files. Contact the person at your organization who installs Integration Services to ascertain the name of the sample database to use for drill-through.
See the Oracle Hyperion Enterprise Performance Management System Installation and Configuration Guide.
Each tutorial task builds upon the previous one, and tasks must be followed in succession.
The examples used in this tutorial are based on the sample database that is included with the Integration Services installation. Contact the person at your organization who installs Integration Services for information about accessing the sample database.
Set the options in the Essbase Options dialog box as described in Setting Essbase Options. If the option settings differ, the illustrations presented in this chapter may not match the spreadsheet view.
If you err during the tutorial, select Essbase, and then FlashBack, to return to the previous spreadsheet view.
 To access the sample file and sample database:
Open Essdt.xls from EPM_ORACLE_HOME/products/Essbase/EssbaseClient/client/sample
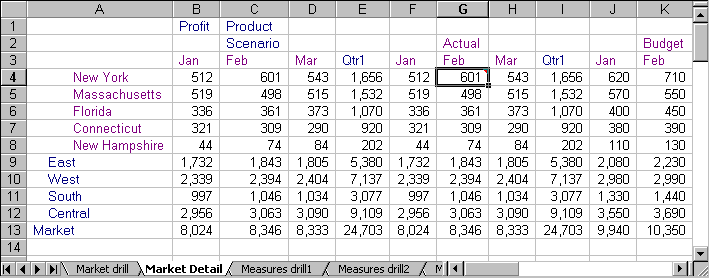
In this example, the Market Detail sheet is selected. The default sheet that is selected when you first open the file may differ.
The sample file shows data for members of an Essbase database. This sample file contains these three predefined drill-through reports, indicated by the tabs of the spreadsheet: “Market Detail,” “Measures Detail,” and “Product Detail.” Using drill-through, you can access these reports and customize them so that Integration Services retrieves only the data that you need and displays it in the desired format.
Select Essbase, then Connect, and then connect to the sample database.
In Style, under Data Cells, select Integration Server Drill-Through, and then click Format.
From Color, select Blue, and then click OK.
In the Essbase Options dialog box, an example of the selected style is displayed in the Sample box.
Select Essbase, and then Retrieve.
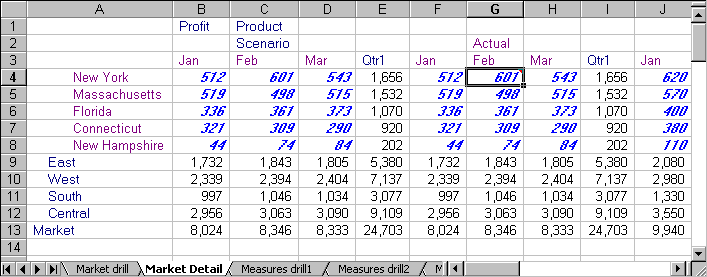
The sample drill-through report is associated with the data cells for Actual, Profit, and Product at the month and Eastern state levels, so that these data cells are displayed in blue, bold, and italic font.
 To access the sample drill-through report from Spreadsheet Add-in:
Select a drill-through cell; for example, cell G4.
You can also select a continuous range of cells from the same parent in one dimension to display all drill-through reports associated with the cells that you select. In this example, only one drill-through report is attached to the range of cells.
In order for Integration Server to return a valid drill-through report when multiple cells are selected, all members selected for the multiple-cell drill-through must come from:
Select one method to access the Linked Objects Browser:
In Essbase Options (Global page), select Enable Linked Object Browsing.
This option enables you to double-click a linked object cell to open the Linked Objects Browser dialog box.
This option works only with single-cell selection. If you select a range of cells, use the Essbase Linked Objects menu command.
Select the drill-through report entry, and then click View/Launch.
In Select Drill-Through Report, select Market detail, and then click Execute.
The results of the drill-through report are displayed in a spreadsheet. The results of the Market Detail report shows that the regional director for the East region is John West and that the population for New York is between 18,000,001-21,000,000.
If only one report is available for the cells that you select in the spreadsheet, and if that report is not designed to be customized, the drill-through process generates the report and immediately displays the results in the spreadsheet. The person at your organization who develops drill-through reports specifies whether you can customize a report and whether you must log on to access the drill-through report and the relational data source.
Follow the steps in Lesson: Selecting Drill-Through Reports to View or Customize to select a report to customize.


