The Measure Performance Report provides an overview of the performance of all the measures that you can view. Measures are grouped by perspective. Composite and dimensional measures are displayed in hierarchies that you can expand to access more information.
 To open the report, select the Browser View, select
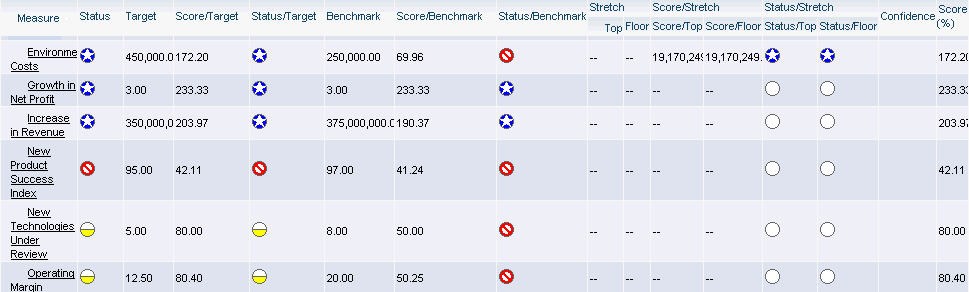
 Although you can customize the report settings, the following information for each measure is displayed.
If unread notes exist
Status column indicating overall performance levels using status symbols
Note:
Performance is evaluated using the target selected from the Report Target list on the toolbar. If you customize the report to assess measure performance using multivalue targets, columns for each multivalue target value contain the score and status symbol indicating measure performance against each target.
Performance trend, indicating if performance has improved, declined, or is the same
Current result value
Current period-to-date result value. If entered manually, this value overrides period-to-date results calculated by a formula or function
Current target value. Values for multivalue targets are also displayed.
Unit that quantifies each measure, such as $(million) or # of Claims
Current score as a percent
Variance that represents, as a percent, the amount by which results deviate from those anticipated and represented by targets
You can perform these tasks:
Calculate measure data using another performance target by selecting it from the Report Target list on the toolbar.
Select individual measure to access their details and perform tasks such as enter target values, result values, create initiatives, and graph current or historic data. See Using Measure Detail Reports.
View the previous performance level and data of any measure, by its performance indicator
Change the content displayed by selecting Edit, selecting Customize, and applying any of these settings:
Table 10. Measure Performance Report Options
Option
Description
Show composite and dimensional measures as trees
Displays composite and dimensional measures hierarchies.
Note:
If selected, you cannot export to Excel.
Name
Displays the name of each measure.
Notes Indicates if new unread notes exist.
Status
Displays the performance level, as a symbol, for measures.
Trend
Displays the performance trend for each measure. This indicates if performance has improved, declined, or not changed.
Result
Lists the result for all measures.
Target
Evaluate performance and perform calculations using the report target. This is the target selected from the Report Target list on the toolbar.
PTD result
List the result of period-to-date function applied to measures.
Units Displays the unit quantifying measure results. Score
Displays measure scores.
Show status as background color
Displays the color selected for the appropriate performance indicator in the score cell on the report.
Variance (%)
Displays the percentage by which measure results deviate from their target. For example, if the target for Measure A is 200, and the result is 160, variance is (200-160)/100.
Data Confidence (fraction) Displays, as a fraction, the extent to which missing results for dimensional or composite measures impact the performance of related measures. For example, if a dimensional measure has three children, and only one has a result, the confidence value is 1/3.
Data Confidence (%) Displays, as a percent, the extent to which missing dimensional or composite measure results impact measure performance. For example, if a dimensional measure has three children, and only one has a result, the confidence value is 33%.
Targets Shown
Create columns that assess measure performance using each target that you select. You can represent performance levels using scores or status symbols, and display target values