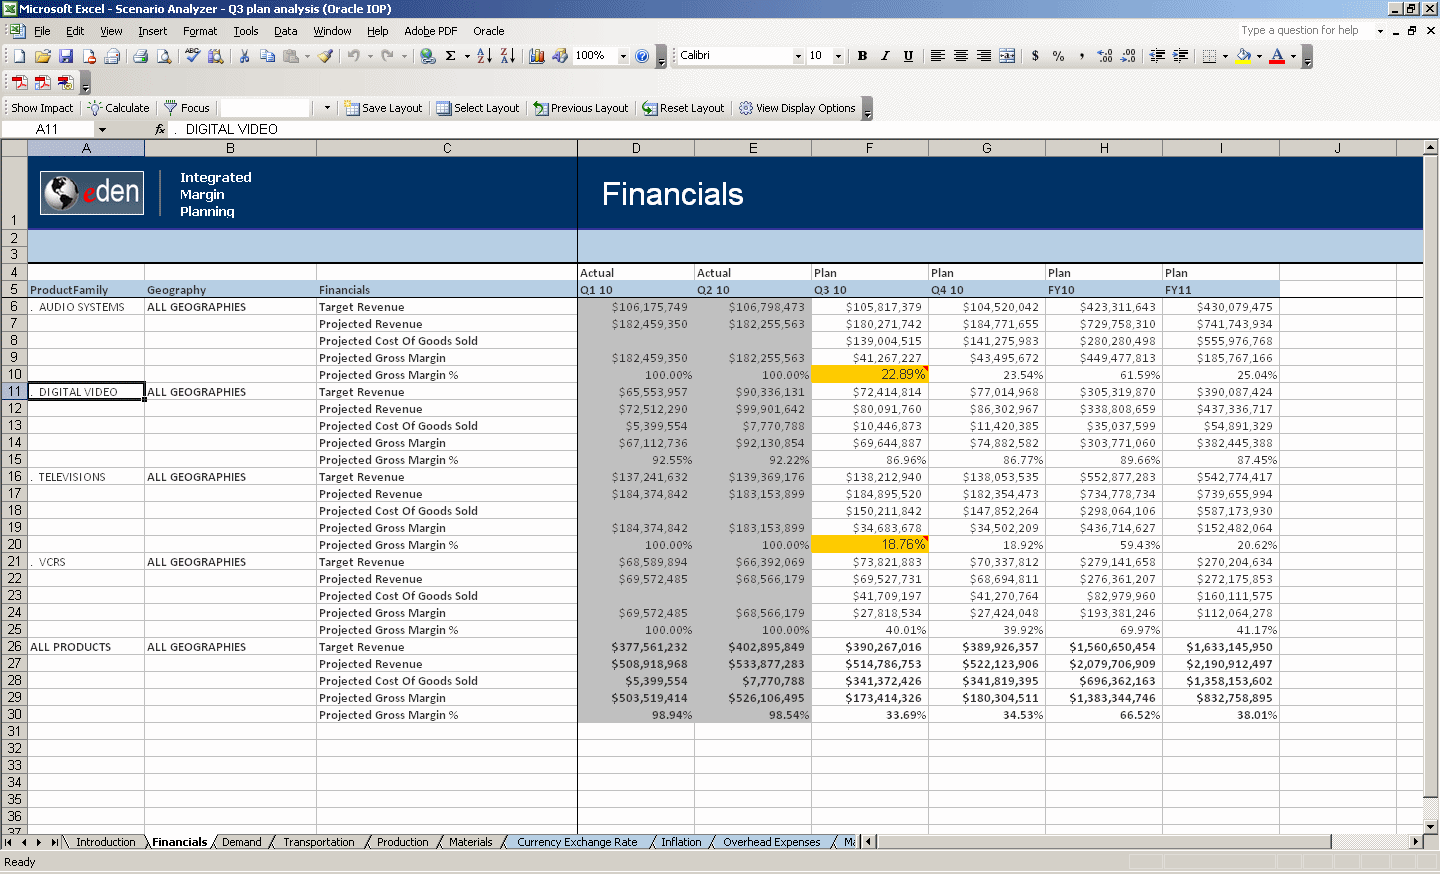
The Financials analysis sheet shows key revenue and margin metrics by product family, geography, and month. The default view shows the following measures:
Target Revenue—Top-down revenue targets by product family and month
Projected Revenue— Latest rolling bottom-up revenue projections by product family, geography, and month
Projected Cost of Goods Sold—Latest rolling bottom-up projections on cost of goods sold by product family, geography, and month
Projected Gross Margin—Latest rolling bottom-up projections on gross margin by product family, geography, and month
Projected Gross Margin Percentage—Latest rolling bottom-up projections on gross margin percentage by product family, geography, and month
Note: | See Financials Cube for detailed information about the predefined content in the Financials analysis sheet. |
Right-click an item to change the data display. Table 1 describes the display options available for the items in the Financials analysis sheet.
Table 1. Financials Items and Their Display Options
| Item in Excel | Display Options |
|---|---|
| Product | Zoom In Zoom Out Include Parent Show Summary Show Product Family Show Product Line Show Product Model Show Description |
| Geography | Zoom In Zoom Out Include Parent Show Summary Show Region Show Territory Show Description |
| Financials | Select Measures Show Summary Show COGS Details Show Detail Show Debug Measures Show Description Show Formula |
| Time Period | Insert/Edit Comment Add to Key Metrics Currency Exchange Details Financial Targets Inflation Assumptions Overhead Expense Details Clear Report |
