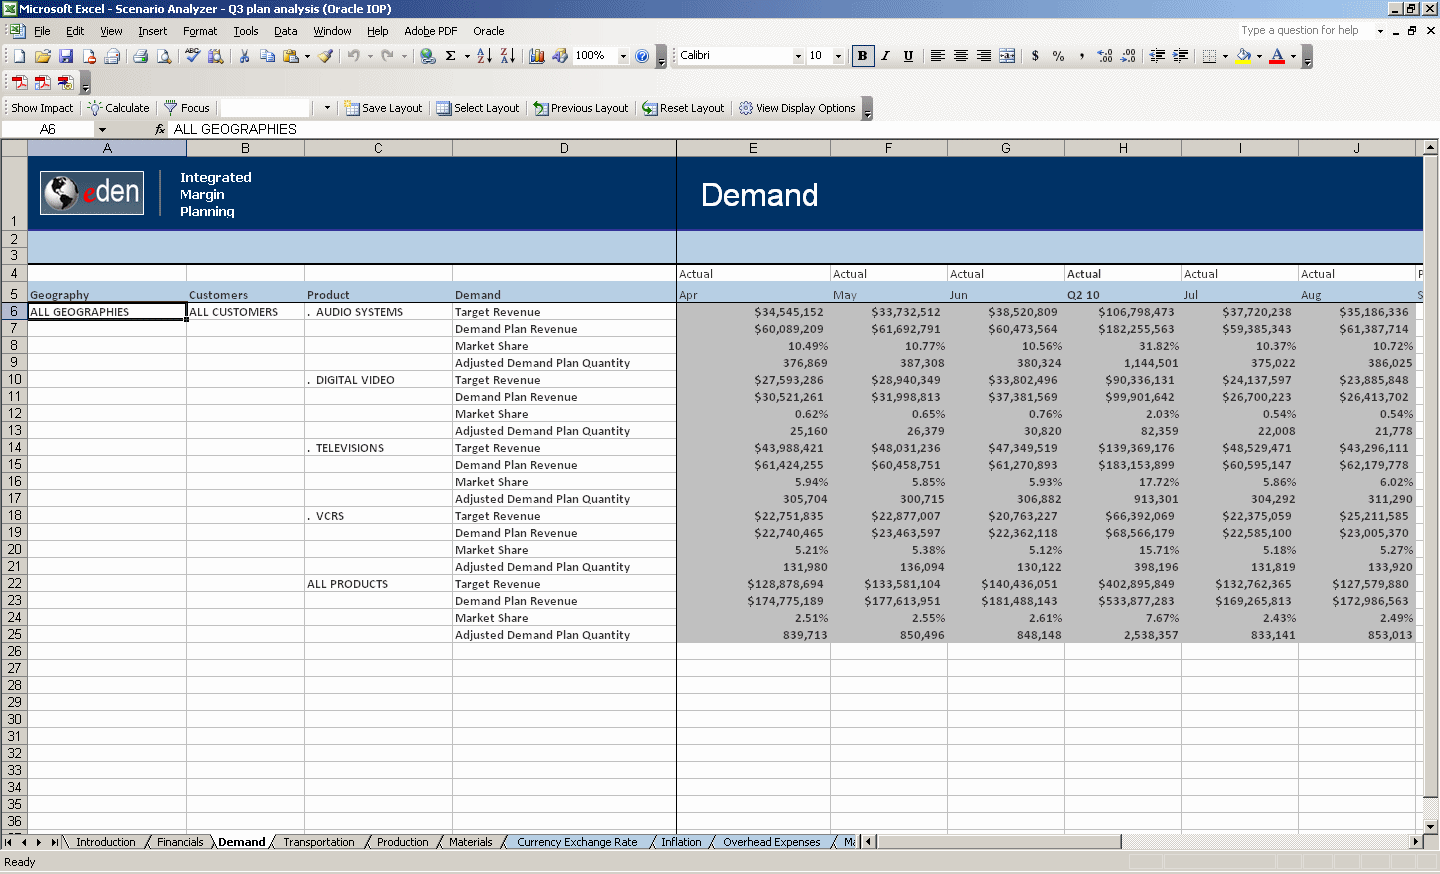
The Demand analysis sheet shows demand and revenue plan details by geography, customer segment, product, and month. Use the Demand analysis sheet to understand how the revenue numbers in your plan were calculated. The default view shows the following measures:
Target Revenue—Top-down revenue targets by product family and month
Demand Plan Revenue—Latest rolling bottom-up revenue projections by product, geography, customer, and month. Displayed as Projected Revenue in the Financials analysis sheet.
Market Share—Percentage of the market captured by the company
Adjusted Demand Plan Quantity— Latest rolling bottom-up units or volume projections by product, geography, customer, and month
Note: | See Demand Cube for detailed information about the predefined content in the Demand analysis sheet. |
Right-click an item to change the data display. Table 2 describes the display options available for the items in the Demand analysis sheet.
Table 2. Demand Items and Their Display Options
| Item in Excel | Display Options |
|---|---|
| Geography | Zoom In Zoom Out Include Parent Show Summary Show Region Show Territory Show Description |
| Customers | Zoom In Zoom Out Include Parent Show Summary Show Customer Show Description |
| Product | Zoom In Zoom Out Include Parent Show Summary Show Product Family Show Product Line Show Product Model Show Description |
| Demand | Select Measures Show Summary Show Units Show Dollars Show Details Show Debug Measures Show Description Show Formula |
| Time Period | Insert/Edit Comment Add to Key Metrics ASP Details Financial Target Details Market Details Clear Report |
