The Configuration Utility is installed with Oracle Financial Management Analytics. After you have installed Oracle Financial Management Analytics, use the Configuration Utility to define the Financial Management metadata structures upon which your Oracle Financial Management Analytics dashboards will be built, and to select the elements and dimensions that you want to be available for display on the dashboards.
Within Oracle BI EE, you can load only one repository file (RPD) at a time. You can use the Configuration Utility at any time to modify the Oracle Financial Management Analytics configuration, or run the utility as many times as required to associate with a different RPD. If you need to merge an existing repository with an Oracle Financial Management Analytics repository, see Merging Repositories .
Caution! | To complete the Configuration Utility, Oracle highly recommends that you have extensive business knowledge of your Financial Management and Financial Close Management applications, and that you are an Oracle Financial Management Analytics system administrator. |
 To run the Configuration Utility:
Ensure that you can connect to the BI Admin Server and Financial Management Client, and verify the server details.
In the Oracle BI EE Administration Tool, open the RPD, and change the default repository password before running the Configuration Utility. By default, the password for the shipped repository is welcome1.
You require the correct RPD password to upload the repository during configuration, but you cannot change the password when running the Configuration Utility.
From the main menu, select Start, then All Programs, then Oracle Financial Management Analytics, and then Configuration Utility.
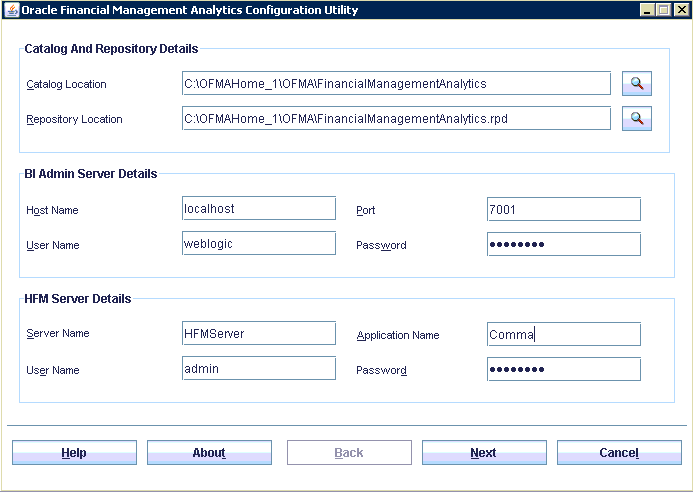
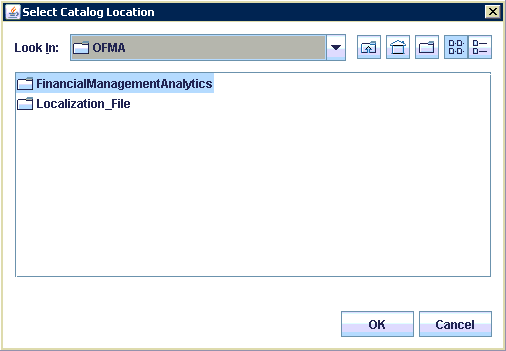
In Catalog Location under Catalog and Repository Details, click the Browse icon
 to display the Select Catalog Location dialog box.
 Select the FinancialManagementAnalytics catalog folder that contains the definitions of the available dashboard graphs in which you will configure the custom Financial Management or Financial Close Management application, and then click OK.
By default, the catalog is located in <OFMA Installed Location>\OFMAHome_1\OFMA.
In Repository Location under Catalog and Repository Details, click the Browse icon
to display the Select RPD File dialog box. By default, the repository is located in <Installed Location>\OFMAHome_1\OFMA.
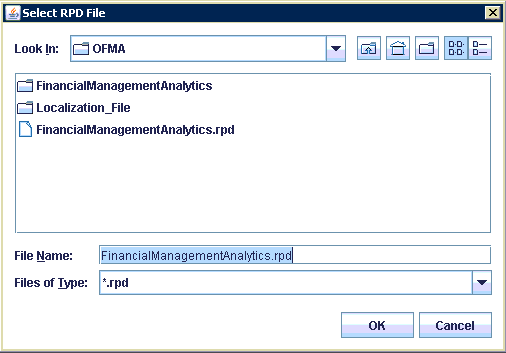
Select the repository (RPD) file (FinancialManagementAnalytics.rpd), and then click OK.
Under BI Admin Server Details, complete these fields:
In Host Name, enter the Admin server name where Oracle BI EE is installed and running.
In Port, enter the port number.
In User Name, enter the Administrator user name for the Admin server.
In Password, enter the Administrator password for the Admin server.
Under HFM Server Details, enter the following details for the selected Financial Management source:
Enter the name of the cluster or Server Name on which the Financial Management application resides.
Enter the Application Name of the Financial Management application that you will be using with Oracle Financial Management Analytics.
Enter the User Name and Password associated with the Financial Management application. This user requires the appropriate rights and roles to access Financial Management data.
The Configuration Utility connects to the Financial Management application for which you have provided details and extracts metadata information only, based on the user's credentials. No data is extracted. This information is used to configure the dashboards in the next several steps.
Note:
For returning users, if the application name is the same, the original defaults are retained. Modify defaults as required.
If you receive an error message stating that the server is unavailable, perform the following steps:
Check the last line in the OFMA.log to determine the exact cause of the error.
Check the status of the Financial Management or Oracle BI EE server to verify that you are logged in and the server is up and running. If you are connecting to a cluster, ensure all servers in the cluster are up and running independently.
Check that Shared Services is up and running.
For each server, select Start, then Programs, then Administrative Tools, and then Services.
Verify the connection details to the server or cluster, including machine name, port number and login credentials.
Modify the Admin or HFM Server Details, if required.
Retry step 9.
On the Entity Dimension screen, select the regional entities to be displayed on the dashboards, using the following steps:
Click Expand All to view the entire list of entities under Entity Hierarchy.
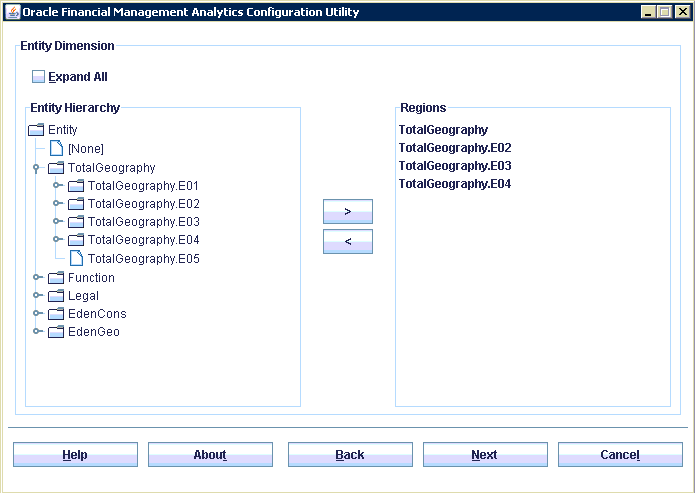
Under HFM Entity Dimension, select the regional entities to be displayed on the dashboards, and use the arrow buttons to move them to the Regions column.
On the Accounts Dimension screen, select the nine account types to be displayed on the dashboards, using the following steps:
Under Account Group, select an account group, such as Balance Sheet Accounts, Income Accounts, or Performance Indicators Accounts.
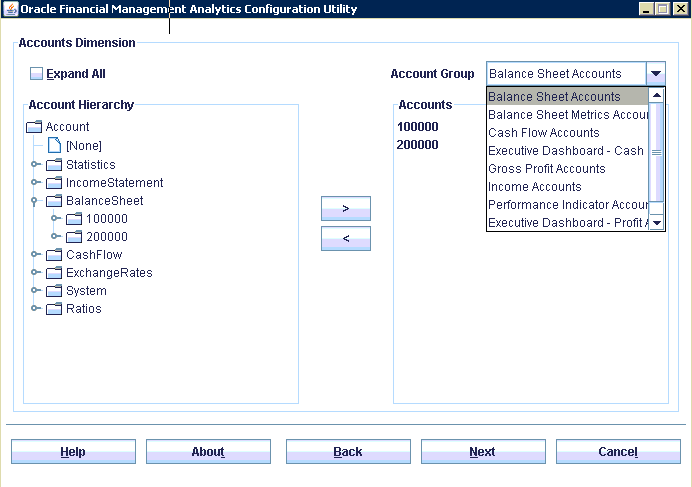
Click Expand All to view the entire list of accounts under Account Hierarchy.
Under Account Hierarchy, select the accounts that you want to display for the selected Account Group, and use the arrow buttons to move them to the Accounts column. The accounts that you select are displayed when you view the dashboards in Oracle Financial Management Analytics.
You must select at least one account for each Account Group, but you may select as many as you require.
Note:
For the Performance Indicator account group only, you must select at least four indicators. The configuration utility will not proceed until at least four are selected. If more than four Performance Indicator selections are made, the additional choices are not displayed on the pie charts on Performance Ratio graphs, although they are available on other reports in the Performance Indicator dashboard.
The following dashboards and reports are affected by your Accounts selections:
Repeat step a to step 12.c for each Account group on the drop-down list to assign accounts for every account group.
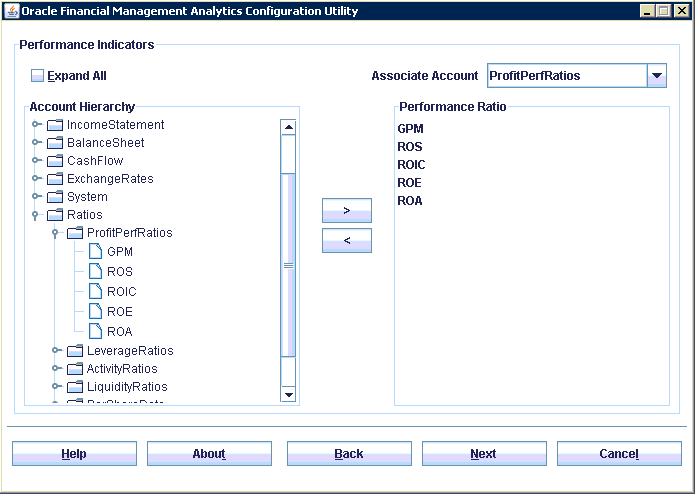
On the Performance Indicators screen, associate accounts with each of the four performance indicators, as outlined in the following steps:
On the Product Dimension screen, select the products that are to be associated with each product dimension, as outlined in the following steps:
From Select Product, select a custom dimension that has a Product hierarchy. These products are set in Financial Management.
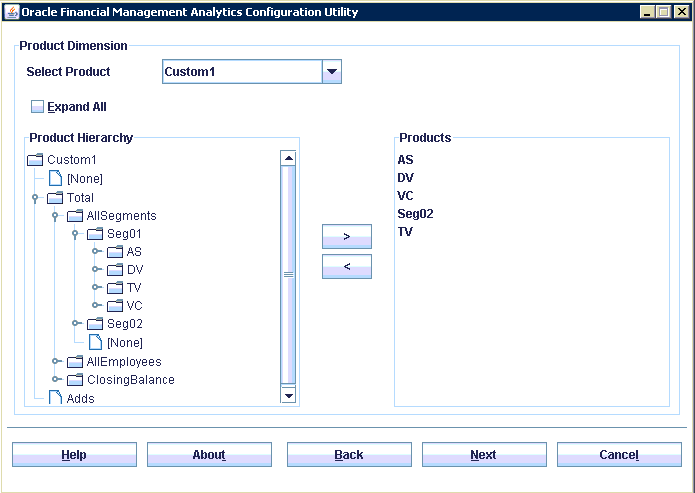
Select Expand All to view the entire hierarchy of the custom dimension member selected.
From the Product Hierarchy, select the products that you require and use the arrow buttons to move them to the Products column. You can choose multiple products, or you may select [None]. The Product dimension and its member selection are required. The products that you choose are displayed when you view the dashboards in Oracle Financial Management Analytics.
Caution!
Product data in multiple dimensions is not supported by Oracle Financial Management Analytics.
The following dashboards and reports are affected by your Products selections:
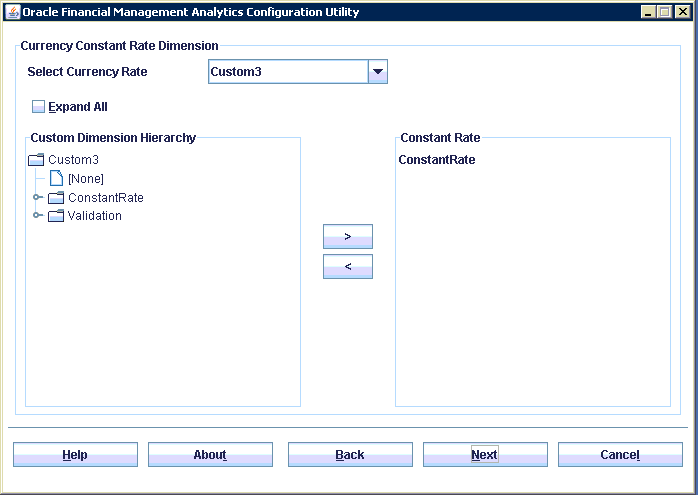
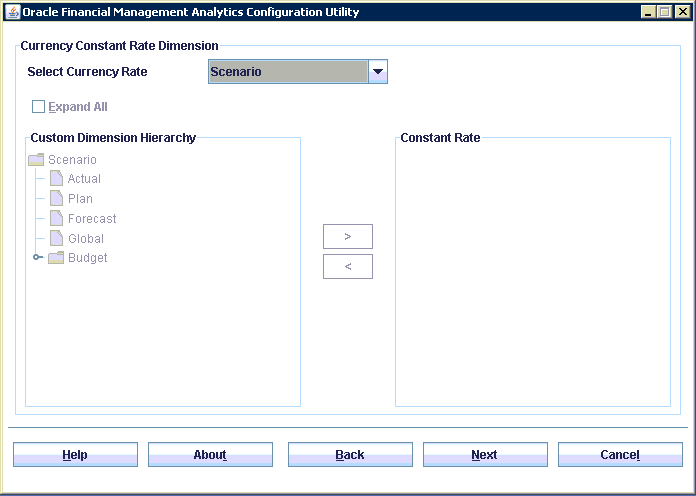
On the Currency Constant Rate Dimension screen, select the custom dimension or Scenario to be used for the Currency Constant Rate dimension:
From the Select Currency Rate drop-down list, select either a custom member or the Scenario dimension to be used as the currency constant rate dimension for the application.
Optional: If a custom dimension was selected, complete the following steps:
Click Expand All to display all members for the selected custom dimension.
Select the members of the custom dimension that you want to display on the report.
Under Custom Dimension Hierarchy, select the members of the custom dimension that you want to display on the report, and then use the arrow buttons to move the member to the Constant Rate column.
Optional: If a Scenario dimension is selected, the Custom Dimension Hierarchy pane is disabled. You do not need to select any members.
In Default Dimension Member, set the default Point of View (POV) for the dashboards, as outlined in the following steps:
From the Default Dimension drop-down list, select a dimension.
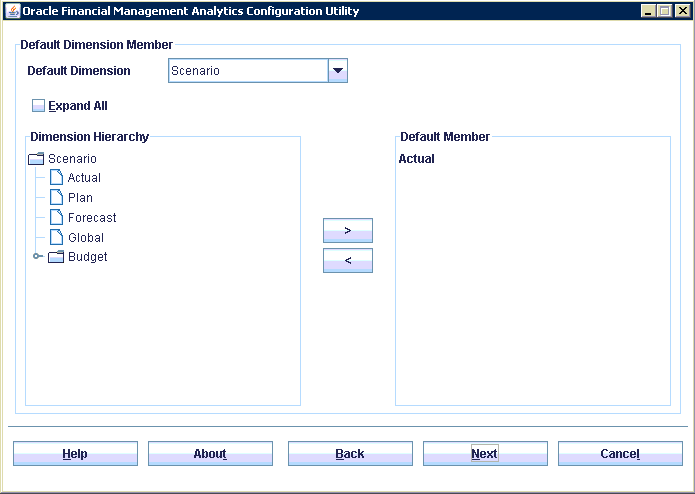
Under Dimension Hierarchy, select the default member for each POV dimension, and then use the arrow buttons to move the member to the Default Member column. Only one member is allowed in the Default Member column.
Repeat step a to step c for each of the POV dimensions:
Scenario, for example, Actual, Plan, Forecast, Global, Budget
Year, for example, 2011
Period, for example, months, quarters, and so on
View, for example, YTD, QTD, Periodic
Entity, for example, a geographic region
Value, for example, the selected currency, such as USD.
Note:
You can rerun the Configuration Utility to change the default dimension members for the POV.
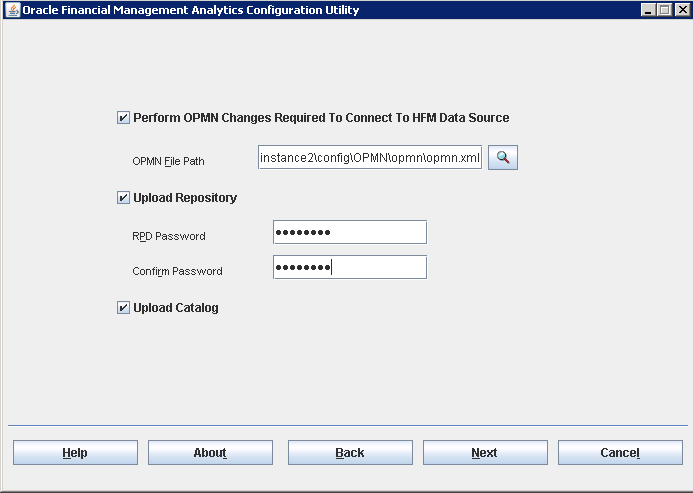
Complete the following information to enable connection between Financial Management and Oracle BI EE:
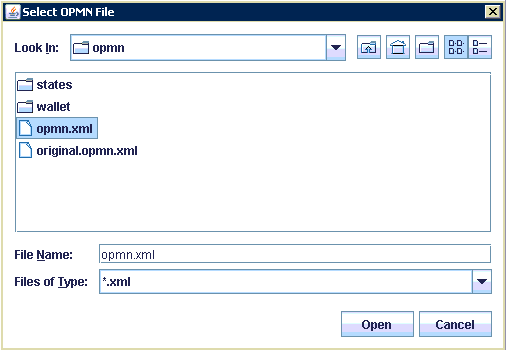
Check OPMN Changes for connecting to Hyperion Financial Management Data Source, and enter the full path to the opmn.xml file, or click the Browse icon
to navigate to the location of the opmn.xml file.By default, the file is located at C:\obiee\instances\instance1\config\OPMN\opmn\opmn.xml. For returning users, this step is not required if the OPMN path was already set as it is a one-time process for a machine.
Caution!
As a best practice, Oracle recommends that you create a backup copy of the opmn.xml file in case you need to restore the file.
Check Upload Repository, to upload the new repository. Enter the RPD password and Confirm Password that you used to open the selected OFMA Repository (RPD).
Note:
For returning users, this step is not required if no changes have been made to the RPD file since the last configuration.
Check Upload Catalog to upload the Oracle Financial Management Analytics catalog to the BI Server.
The Summary screen displays the selections that you have just made using the utility.
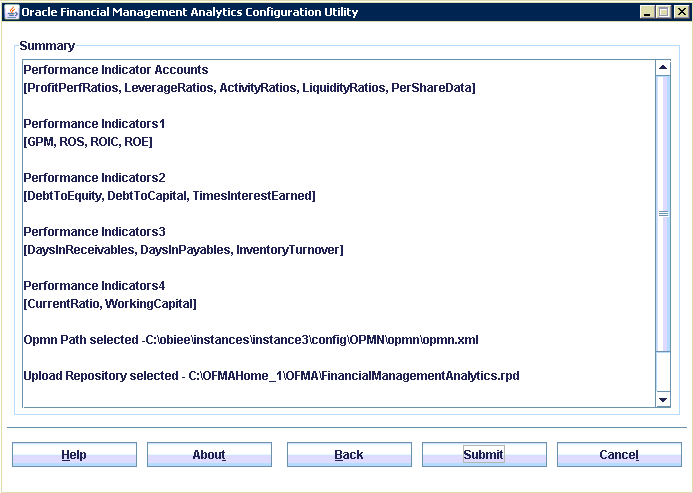
On the Summary screen, review the changes. If necessary, select Back to review and change the selections and entries that you have made on each screen of the Configuration Utility.
Note:
A list of all configuration settings is also available in the OFMA.log file. By default, the log file is located in C:\OFMAHome_1\OFMA.
After reviewing your selections, click Submit to apply the changes.
When the configuration is submitted, the following actions are initiated:
The account, region, product, constant rate and dimension default selection are updated to the catalog (filters and report definitions)
If any of the following changes were selected during configuration, a lock is immediately acquired to the BI Server and the server is stopped:
If changes to opmn.xml is selected, the opmn.xml is edited to include the path to ADM drivers, Financial Management Client, and so on.
If upload repository is selected, the selected RPD file is loaded to the BI Server.
If upload catalog is selected, the selected catalog file is loaded to the BI Server.
The BI Services are restarted and the Configuration Utility exits.
A confirmation dialog box advises when all changes have been successfully submitted. This operation will take a few minutes to complete.
Complete the manual configuration steps. See Performing Manual Configuration Steps.