The report shows the cash flow variance, which is calculated based on the accounts against the different Scenario and Year combinations selected from the dashboard POV and Variance Analysis selector.
The report helps you localize data based on the local currency and understand the financial performance by keeping currency rates constant.
 To compile the Cash Flow Variance At Constant Rate report:
From the Oracle BI EE Global Header, select the Dashboards link, then select the OFMA menu list, and then select Oracle Financial Management Analytics.
From Oracle Financial Management Analytics, select the Currency Analysis dashboard tab.
From POV Selector, select the required POV dimensions that you want to use for the dashboard, and then click Apply.
See Setting the Point of View in Oracle Financial Management Analytics.
In the Variance Analysis Selection POV, select the following dimension members from the list for calculating the variance:
Scenario 2, Year 2 and Constant Rate 2 dimension combinations
Scenario 3, Year 3 and Constant Rate 3 dimension combinations
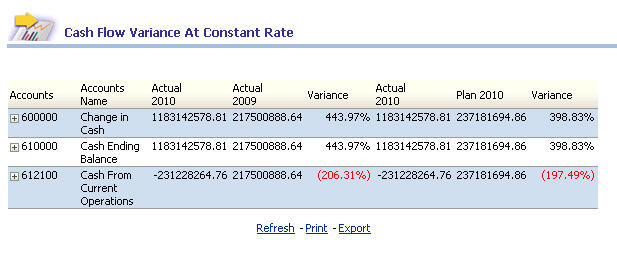
The report displays the following information:
Table 29. Cash Flow Variance At Constant Rate – Report Details
| Report in Detail | Description |
|---|---|
| Accounts Name | The account description |
| Scenario and Year combination | The account value based on only dashboard POV selector - Scenario, and Year |
| Scenario 2 and Year 2 combination | The account value based on Report prompt POV - Scenario 2, and Year 2 |
| Variance Column | Information about the calculated variance between the third column and fourth column Note: If the calculated variance contains negative values, then the value is represented in red within parentheses. In OFMA, the variance analysis reports exhibit the expense reporting behavior. The following are the expense reporting properties:
|
| Scenario and Year combination | The account value based on only dashboard POV selector - Scenario, and Year |
| Scenario 3 and Year 3 combination | The account value based on Report prompt POV - Scenario 3, and Year 3 |
| Variance Column | Information about the calculated variance between the sixth column and seventh column Note: If the calculated variance contains negative values, then the value is represented in red within parentheses. In OFMA, the variance analysis reports exhibit the expense reporting behavior. The following are the expense reporting properties:
|