The Income by Regions report is designed to display the income accounts information across the regions and enables you to perform a Year On Year comparison of the same. This report provides a graphical representation of the data, which involves the analysis of the incomes earned by different geographies, enhancing assets or decreasing liabilities in an accounting period. Use the report to improve and manage the income flow for the different regions in the next review cycle.
Each combination of Scenario and Year dimension member is color-coded; placing the cursor over a bar graph displays the values of that Income Accounts over a specific region. For example, a Net Income Account in the North America region contains a value of approximately $5.9M.
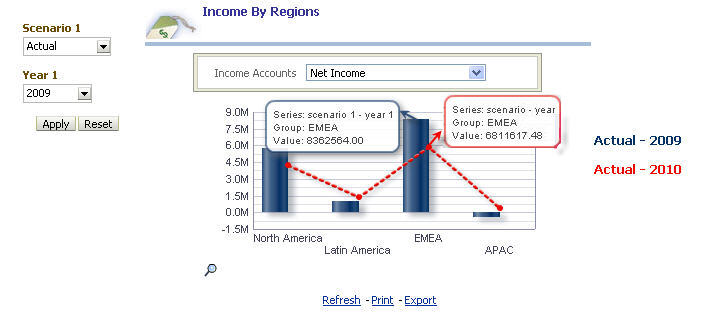
The legend is displayed at the lower right-hand corner of the report, showing the following information:
The blue bar graph displays results based on Scenario 1 and Year 1 selection.
The red dotted line displays results based on the Dashboard POV selection.
Note:
The red dotted line may be discontinued, if the data is not available.
 To compile the Income By Regions report:
From the Oracle BI EE Global Header, select the Dashboards link, then select the OFMA menu list, and then select Oracle Financial Management Analytics.
From Oracle Financial Management Analytics, select the Executive dashboard tab.
From POV Selector, select the required POV dimensions that you want to use for the dashboard, and then click Apply.
See Setting the Point of View in Oracle Financial Management Analytics.
Select the required Scenario 1 and Year 1 POV dimensions that you want to use for Income by Regions report.
Note:
Any changes to Scenario 1 and Year 1 dimension members affect only the Income By Regions report; however, the entire dashboard page is refreshed.
Click Apply to view the changes in the report.
The Income By Regions report is displayed. To view Financial Management values on the report, place the cursor over graphical reports.
The report displays the following information:
Table 6. Income by Regions – Report Details
| Report in Detail | Description |
|---|---|
| Income Accounts | The displayed accounts are mapped from the Financial Management applications. Note: In the Income By Regions report, if you change the Income Accounts drop-down (report prompt)[1], the corresponding changes are viewed within the report. |
| Regions | The regions are displayed on the x-axis, such as Latin America, APAC, and so on. These regions are selected from the dashboard POV selector. Note: The drill through option is not available for regional entities that are displayed on the x-axis. |
| Financial Values | The Financial Management values are displayed toward on the y-axis. |