Net Cash Flow is the change in cash balance of the company over a time period. Cash flow can be influenced by any changes pertaining to the long-term assets, acquisitions, issue of debt, payout of dividends, and so on.
The report estimates cash flow by region, helping you to manage a positive net cash flow.
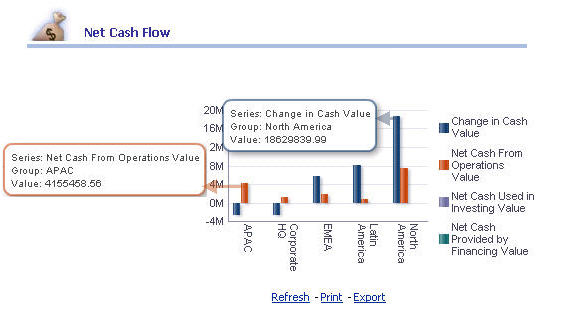
Each Cash Flow account is color-coded; resting the cursor over a cash flow account (color) displays the values of that cash flow account over a specific region. For example, for a Change in Cash account in the North America region contains the value of approximately $18,629,839.99.
The y-axis value in the vertical stacked bar represents the total gross income earned for a region. For example, for a Net cash From Operations account, the total gross income earned in the APAC region is approximately $4,155,458.56.
 To compile a Net Cash Flow report:
From the Oracle BI EE Global Header, select the Dashboards link, then select the OFMA menu list, and then select Oracle Financial Management Analytics.
From Oracle Financial Management Analytics, select the Executive dashboard tab.
From POV Selector, select the required POV dimensions that you want to use for the dashboard, and then click Apply.
See Setting the Point of View in Oracle Financial Management Analytics.
The Net Cash Flow report is displayed. To view Financial Management values on the report, place the cursor over the graphical reports.
The report displays the following information:
Table 5. Net Cash Flow – Report Details
| Report in Detail | Description |
|---|---|
| Regions | The regions are displayed at the bottom of the report (on the x-axis), such as Latin America, APAC, and so on. Select these regions from the dashboard POV selector. Note: The drill through option is available for regional entities that are displayed on the x-axis. |
| Financial Values | The Financial Management values are displayed at the left of the report (on the y-axis). |