The report displays the performance indicator numbers of the company for the different geographical regions. The report helps you to estimate the profit or loss of the product for a region and accounting period. Users can include key performance indicators accounts that results in the profit and loss numbers in this report. Some of the key performance indicators accounts are listed below:
Gross Profit Margin
Return on Assets
Return on Sales
Return on Equity
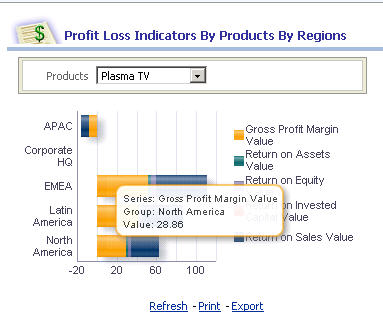
In the report, each Profit and Loss Indicator account is represented by a different color; placing the cursor over an account (color) displays the values of that account in a region. For example, Plasma TV Product for a Gross profit margin account in the North America region contains the value of approximately 28.86.
The X axis value in the horizontal stacked bar represents the total gross income earned for a particular region. For example, for a Plasma TV product, the total gross income earned in the North America region is approximately 61.00.
 To compile the Profit and Loss Indicators By Products By Regions report:
From the Oracle BI EE Global Header, select the Dashboards link, then select the OFMA menu list, and then select Oracle Financial Management Analytics.
From Oracle Financial Management Analytics, select the Executive dashboard tab.
From POV Selector, select the required POV dimensions that you want to use for the dashboard, and then click Apply.
See Setting the Point of View in Oracle Financial Management Analytics.
The Profit and Loss Indicators By Products By Regions report is displayed. To view Financial Management values on the report, place the cursor over graphical reports.
The report displays the following information:
Table 4. Profit and Loss Indicators By Products By Regions – Report Details
| Report in Detail | Description |
|---|---|
| Products | The displayed products are mapped from the Financial Management applications. Note: In the Profit and Loss Indicators By Products By Regions report, if you change the Products drop-down (report prompt)[1], the corresponding changes are viewed within the report. |
| Financial Values | The Financial Management values are displayed on the x-axis. |
| Regions | The regions are displayed on the y-axis. These regions are selected from the dashboard POV selector. Note: The drill through option is available for regional entities that are displayed on the y-axis. |