The gross profit variance is analyzed for different combinations of Scenario and Year dimensions.
The report is represented in the tabular format and helps you analyze the gross profit accounts across different Scenario and Year combination.
 To compile the Gross Profit Variance Analysis report:
From the Oracle BI EE Global Header, select the Dashboards link, then select the OFMA menu list, and then select Oracle Financial Management Analytics.
From Oracle Financial Management Analytics, select the Gross Profit dashboard tab.
From POV Selector, select the required POV dimensions that you want to use for the dashboard, and then click Apply.
See Setting the Point of View in Oracle Financial Management Analytics.
In the Variance Analysis POV selector, select the following dimension members from the list:
Scenario 2 and Year 2 dimension combinations
Scenario 3 and Year 3 dimension combinations
Click Apply to view the changes in the report.
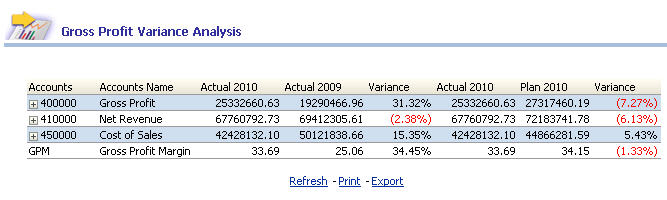
The Gross Profit Variance Analysis report is displayed at the bottom of the screen. Scroll down to see the results.
The report displays the following information:
Table 16. Gross Profit Variance Analysis – Report Details
| Report in Detail | Description |
|---|---|
| Accounts | The account value details From accounts column, you can click the expand icon |
| Accounts Name | The account description |
| Scenario and Year combination | The account value based on only dashboard POV selector - Scenario, and Year. |
| Scenario 2 and Year 2 combination | The account value based on Report prompt POV- Scenario 2, and Year 2. |
| Variance Column | Provides information about the calculated variance between the third column and fourth columns. Note: If the calculated variance contains negative values, then the value is represented in red within parentheses. In OFMA, the variance analysis reports exhibit the expense reporting behavior. The following are the expense reporting properties:
|
| Scenario and Year combination | Contains the account value based on only dashboard POV selector - Scenario, and Year. |
| Scenario 3 and Year 3 combination | Contains the account value based on Report prompt POV- Scenario 3, and Year 3. |
| Variance Column | Provides information about the calculated variance between the sixth column and seventh column. Note: If the calculated variance contains negative values, then the value is represented in red within parentheses. In OFMA, the variance analysis reports exhibit the expense reporting behavior. The following are the expense reporting properties:
|