The Process Management metrics report provides the status of the descendant entity on changing the process state from First Pass state to Approved or Submitted.
The report provides an in-depth analysis of the process levels from Close to Submit status and from Close to Approve status for different entities.
 To compile the Process Management Metrics report:
From the Oracle BI EE Global Header, select the Dashboards link, then select the OFMA menu list, and then select Oracle Financial Management Analytics.
From Oracle Financial Management Analytics, select the Process Management dashboard tab.
From POV Selector, select the required POV dimensions that you want to use for the dashboard, and then click Apply.
See Setting the Point of View in Oracle Financial Management Analytics.
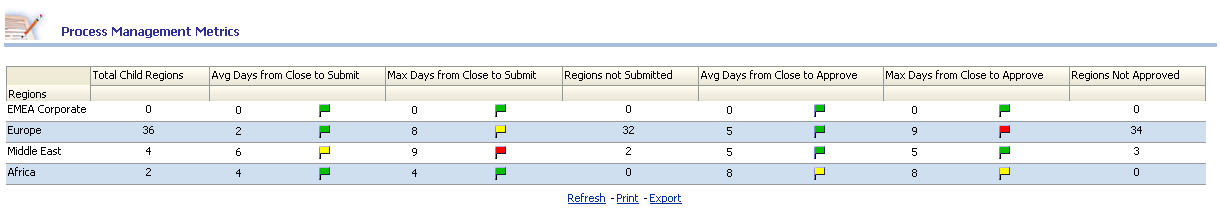
The Process Management Metrics report is displayed.
The color code represents the phase of calculating the number of days for changing the process state. For example:
The
 green flag indicates that process units are progressing within expected time lines. By default, the green flag indicates the process units are within 0 to eight days of the time frame.
The
 yellow flag indicates that process units have been delayed. By default, the yellow flag indicates that process units are within nine to 12 days of time frame.
The
 red flag indicates that process units are experiencing significant issues. By default, the red flag indicates that the process units exceed the 12-day limit.
Note: | The status of the flags can be modified only by the administrator. |
The report displays the following information:
Table 31. Process Management Metrics – Report Details
| Column Name | Column Description |
|---|---|
| Regions | The child entities of the entity selected in the dashboard POV |
| Total Child Regions | The total number of descendant entities member for the entity at a location |
| Average Number of Days from Close to Submit | The average number of days for the descendant entity to change the process state from the Close date to Submitted status. Formula for calculating Average Number of days from Close to Submit: ∑(Number of days taken by each individual entity to change the process state from Close date to the Submitted Status)/Total Number of Submitted entities. Note: If an entity has not had Submitted status, then the calculation is taken from the date on which the report is generated. |
| Maximum Number of Days from Close to Submit | The maximum number of days that any descendant entity has to change the process state from the Close date to Submitted status. Formula for calculation: ∑(Maximum Number of days taken by all the descendants to change the process to Submitted state.) Note: If an entity has not had Submitted status, then the calculation is taken from the date on which the report is generated. |
| Number of Regions Not Submitted | The number of descendant entities in the following states:
|
| Average Number of Days from Close to Approve | The average number of days the descendant entity to change of process state from the Close date to Approved status. Formula for calculating Average Number of days from Close to Approve: ∑(Number of days taken by each individual entity to change the process state from Close date to the Approved Status)/Total Number of Approved entities. Note: If an entity has not had Approved status, then the calculation is taken from the date on which the report is generated. |
| Maximum Number of Days from Close to Approve | The maximum number of days that any descendant entity to change of process state from the Close date to Approved. Formula for calculation: ∑(Maximum Number of days taken by all the descendants to change the process to Approved state.) Note: If an entity has not had Approved Status, then the calculation is taken from the date on which the report is generated. |
| Number of Regions Not Approved | This column represents the number of descendants in the following states:
|