The report provides an indicative values based on parameters such as:
Profit and Loss
Gross Profit Margin
Return on Assets
Return on Sales
Return on Equity
You can calculate the variance for Performance Indicators Year on Year report based on the these parameters. These are primarily calculated based on the market trends and current status of the company.
The report helps you assess the company’s performance based on the performance indicators across accounting periods.
 To compile the Performance Indicators Year on Year report:
From the Oracle BI EE Global Header, select the Dashboards link, then select the OFMA menu list, and then select Oracle Financial Management Analytics.
From Oracle Financial Management Analytics, select the Performance Indicators dashboard tab.
From POV Selector, select the required POV dimensions that you want to use for the dashboard, and then click Apply.
See Setting the Point of View in Oracle Financial Management Analytics.
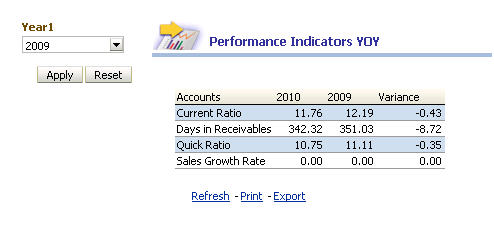
From the Performance Indicators Year on Year report, select the Year 1 dimension for the purpose of variance calculations.
The report displays the following information:
Table 7. Performance Indicators Year on Year – Report Details
| Report in Detail | Description |
|---|---|
| Accounts Column | The account details based on the dashboard POV selector |
| Year Column | The account value based on Year dimension selected from the dashboard POV selector |
| Year 1 Column | The account value based on Year 1 dimension selected from the Performance Indicators Year on Year report |
| Variance Column | Information about the calculated variance between the second and third columns |