Prints a chart. Only PostScript printers or HP printers that support HPGL (generally, this is HPLaserJet 3 and higher) render chart output.
PRINT-CHART[chart_name]position
[TYPE={chart_type_txt_lit|_var|_col}]
[CHART-SIZE=(chart_width_num_lit|_var|_col, chart_depth_num_lit|_var|_col)]
[TITLE={title_txt_lit|_var|_col}]
[SUB-TITLE={subtitle_txt_lit|_var|_col}]
[FILL={fill_txt_lit|_var|_col}]
[3D-EFFECTS={3d_effects_txt_lit|_var|_col}]
[BORDER={border_txt_lit|_var|_col}]
[COLOR-PALETTE=color_palette_lit|_var|_col]
[POINT-MARKERS={point_markers_txt_lit|_var|_col}]
[ATTRIBUTES={selector_lit|_var|_col|
   LIST:{selector_list_name_lit|_var|_col|
     (selector_lit|_var|_col,...)},{decl_key_lit|_var|_col,
     {decl_value_lit|_var|_col|
        LIST:{decl_val_list_name_lit|_var|_col|
          (decl_val_lit|_var|_col,...)}|
        PALETTE:{color_palette_lit|_var|_col}}},...}}]
[DATA-ARRAY=array_name]
[DATA-ARRAY-ROW-COUNT={x_num_lit|_var|_col}]
[DATA-ARRAY-COLUMN-COUNT={x_num_lit|_var|_col}]
[DATA-ARRAY-COLUMN-LABELS={NONE|array_name|({txt_lit|
_var|_col},...)}]
[DATA-LABELS={data_labels_txt_lit|_var|_col}]
[FOOTER-TEXT=NONE|text_lit|_var|_lit]
[SUB-FOOTER-TEXT=NONE|text_lit|_var|_col]
[ITEM-COLOR=(item_color_keyword|_lit|_var|_col,
{color_txt_lit_var|_col}|(r,g,b))]
[ITEM-SIZE=(item_size_keyword_lit|_var|_col,
item_size_num_lit|_var|_col)]
[LEGEND={legend_txt_lit|_var|_col}]
[LEGEND-TITLE={legend_title_txt_lit|_var|_col}]
[LEGEND-PLACEMENT={legend_placement_txt_lit|_var|_col}]
[LEGEND-PRESENTATION={legend_presentation_txt_lit| _var|_col}]
[PIE-SEGMENT-QUANTITY-DISPLAY={pie_segment_quantity_
display_txt_lit|_var|_col}]
[PIE-SEGMENT-PERCENT_DISPLAY={pie_segment_percent_
display_txt_lit|_var|_col}]
[PIE-SEGMENT-EXPLODE={pie_segment_explode_txt_lit| _var|_col}]
[X-AXIS-GRID={x_axis_grid_txt_lit|_var|_col}]
[X-AXIS-LABEL={x_axis_label_txt_lit|_var|_col}]
[X-AXIS-MIN-VALUE={x_axis_min_value_num_lit|_var|_col}]
[X-AXIS-MAX-VALUE={x_axis_max_value_num_lit|_var|_col}]
[X-AXIS-MAJOR_INCREMENT={x_axis_major_increment_num_lit|_var|_col}]
[X-AXIS-MINOR-INCREMENT={x_axis_minor_increment_num_lit|_var|_col}]
[X-AXIS-MAJOR-TICK_MARKS={x_axis_major_tick_marks_txt_lit|_var|_col}]
[X-AXIS-MINOR-TICK-MARKS={x_axis_minor_tick_marks_txt_lit|_var|_col}]
[X-AXIS-TICK-MARK-PLACEMENT={x_axis_tick_mark_placement
_txt_lit|_var |_col}]
[X-AXIS-ROTATE={x_num_lit|_var|_col}]
[X-AXIS-SCALE={x_axis_scale_txt_lit|_var|_col}]
[Y-AXIS-GRID={y_axis_grid_txt_lit|_var|_col}]
[Y-AXIS-LABEL={y_axis_label_txt_lit|_var|_col}]
[Y-AXIS-MASK={mask_txt_lit|_var|_col}]
[Y-AXIS-MIN-VALUE={y_axis_min_value_num_lit|_var|_col}]
[Y-AXIS-MAX-VALUE={y_axis_max_value_num_lit|_var|_col}]
[Y-AXIS-MAJOR-INCREMENT={y_axis_major_increment_num_lit|_var|_col}]
[Y-AXIS-MINOR_INCREMENT={y_axis_minor_increment_num_lit|_var|_col}]
[Y-AXIS-MAJOR-TICK-MARKS={y_axis_major_tick_marks_txt_lit|_var|_col}]
[Y-AXIS-MINOR-TICK-MARKS={y_axis_minor_tick_marks_txt_lit|_var|_col}]
[Y-AXIS-TICK-MARK-PLACEMENT={y_axis_tick_mark_placement
_txt_lit|_var|_col}]
[Y-AXIS-SCALE={y_axis_scale_txt_lit|_var|_col}]
[Y2-AXIS-LABEL={y2_axis_label_txt_lit|_var|_col}]
[Y2-AXIS-MASK={mask_txt_lit|_var|_col}]
[Y2-AXIS-MIN-VALUE={y2_axis_min_value_num_lit| _var|_col}]
[Y2-AXIS-MAX-VALUE={y2_axis_max_value_num_lit|_num_lit| _var|_col}]
[Y2-AXIS-MAJOR-INCREMENT={y2_axis_major_increment_num_lit|_var|_col}]
[Y2-AXIS-MINOR-INCREMENT={y2_axis_minor_increment_num_lit|_var|_col}]
[Y2-AXIS-MAJOR-TICK-MARKS={y2_axis_major_tick_marks
_txt_lit|_var|_col}]
[Y2-AXIS-MINOR-TICK-MARKS={y2_axis_minor_tick_marks
_txt_lit|_var|_col}]
[Y2-AXIS-SCALE={y2_axis_scale_txt_lit|_var|_col}]
[Y2-COLOR-PALETTE=color_palette_lit|_var|_col]
[Y2-DATA-ARRAY=array_name]
[Y2-DATA-ARRAY-ROW-COUNT={x_num_lit|_var|_col}]
[Y2-DATA-ARRAY-COLUMN-COUNT={x_num_lit|_var|_col}]
[Y2-DATA-ARRAY-COLUMN-LABELS={NONE|array_name|
({txt_lit|_var|_col},...)}]
[Y2-TYPE={chart_type_txt_lit|_var|_col}]
Name of the chart defined in DECLARE-CHART. This name is not necessary if you specify the CHART-SIZE and all other pertinent attributes in PRINT-CHART.
(row, column) Position of the upper left corner. Position parameters can be relative. See POSITION for examples of relative positioning. Document markers are not allowed. After execution, the current position is returned to this location; however, the next listing line is the next line below the bottom of the chart area. (This is different than the way the PRINT command works.)
For definitions of the other arguments in PRINT-CHART, see DECLARE-CHART. For information on NewGraphics, see NewGraphics under [Default-Settings] Section.
PRINT-CHART directs Production Reporting to output a chart according to the named chart, if any, and the overridden attributes, if any.
As you use PRINT-CHART, keep in mind the following:
All the arguments defined for DECLARE‑CHART are valid for PRINT‑CHART. (See Table 20, DECLARE-CHART Arguments for argument descriptions.) The only exception is the position argument, which specifies the position of the chart. This argument is required and is only valid for PRINT‑CHART.
The data that supports the charts is defined in the following arguments: (Y2 arguments are for combination charts.)
The following arguments must be specified in either DECLARE-CHART or PRINT-CHART:
The following arguments are required for combination charts and must be specified in either DECLARE-CHART or PRINT-CHART:
PRINT-CHART can be used without referencing a named chart if all required attributes for the DECLARE-CHART are supplied in addition to all its required parameters.
PRINT-CHART directs Production Reporting to display the chart on the current page using the attribute values at the moment the command is executed. Manipulation of chart attribute values has no effect on the appearance of the chart after PRINT-CHART is executed.
For example, if you execute a PRINT‑CHART with TITLE=$ttl and $ttl='Encouraging Results', and then change the value of $ttl to 'Discouraging Results' immediately afterward, then the chart is printed with first value, 'Encouraging Results'.
PRINT-CHART expects the DATA-ARRAY to be organized in a particular way. See Table 65, Chart Array Field Types (fewer than four fields) for details.
PRINT-CHART fills the area defined by CHART-SIZE as much as possible while maintaining an aesthetically pleasing ratio of height to width. In cases where the display area is not well suited to the chart display, the chart is centered within the specified region, and the dimensions are scaled to accommodate the region. Therefore, do not be alarmed if the chart does not fit exactly inside the box you have specified. It simply means that Production Reporting has accommodated the shape of the region to provide the best looking chart possible.
Chart commands used to send output to a line printer are ignored. Only PostScript printers or HP printers that support Hewlett Packard's HPGL (generally, this is HP LaserJet model 3 and higher) render chart output. If you attempt to print a chart to a LASERJET printer that does not support HPGL, the HPGL command output will likely become part of your output, leaving one or more lines of meaningless data across your report.
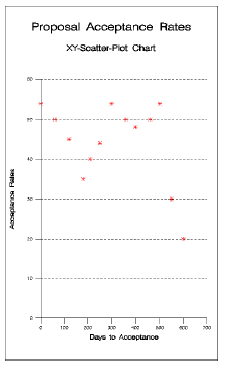
If the first field in the array designated by DATA-ARRAY is of type CHAR, then the value on the x-axis is the contents of that column. If the first field is not of type CHAR, then the value of the x-axis is the row number of the array designated by DATA-ARRAY, beginning with 1. Pie charts show the character value in the legend area. Histograms show the character value on the y-axis. XY-Scatter charts do not use the character value and none is needed in the array.
If a PIE chart contains many small slices, the user must set the PIE‑SEGMENT‑QUANTITY-DISPLAY and/or PIE-SEGMENT-PERCENT-DISPLAY arguments to NO to prevent the values from one slice overwriting the values of another slice.
As was mentioned earlier, each chart type meets a specific organizational requirement. Table 65 and Table 66 describe these requirements.
Table 65. Chart Array Field Types (fewer than four fields)
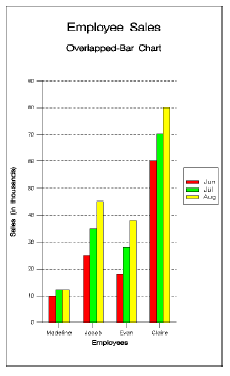
LINE BAR STACKED‑BAR 100%‑BAR OVERLAPPED‑BAR HISTOGRAM AREA STACKED‑AREA 100%‑AREA | ||||


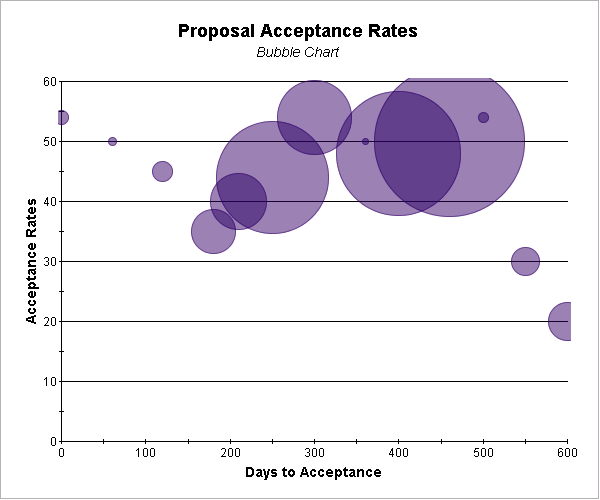
See “Creating Bubble Charts” in Volume 1 of the Hyperion SQR Production Reporting Developer's Guide for information on creating a Bubble Chart.
See”Use ATTRIBUTES in DECLARE-CHART and PRINT-CHART” in Volume 1 of the Production Reporting Developer's Guide for information on combination charts created using the Y2-Axis syntax in DECLARE-CHART and PRINT-CHART.
In the “Sales by Region for the Year” example below, a pie chart is printed without explicit reference to a chart declared with DECLARE-CHART.

You must supply all necessary arguments in PRINT-CHART as shown in the following code:
.
.
create-array
  name=q_four
  size=8
  field=name:char
  field=num:number=0.
.
print-chart (,1)
  title = 'Sales by Region for the Year'
  sub-title = NONE
  chart-size = (40, 20)
  type = pie
  3d-effects = yes
  legend-title = 'Region'
  legend = yes
  border = no
  pie-segment-quantity-display = no
  pie-segment-explode = max
  data-array = q_four
  data-array-column-count = 3
  data-array-row-count = 8
DECLARE-CHART