| Oracle® Enterprise Manager Cloud Control Getting Started with Oracle Fusion Middleware Management 12c Release 2 (12.1.0.2) Part Number E24215-04 |
|
|
PDF · Mobi · ePub |
| Oracle® Enterprise Manager Cloud Control Getting Started with Oracle Fusion Middleware Management 12c Release 2 (12.1.0.2) Part Number E24215-04 |
|
|
PDF · Mobi · ePub |
The JBoss Application Server is an open source application server that is organized in partitions and clusters. JBoss also supports standalone servers that are not part of any cluster. Multicasting is also supported, but needs to be disabled for Enterprise Manager discovery.
The following topics are discussed in this document
To setup JBoss Application Server, download and extract the corresponding zip file and set the JBOSS_HOME and PATH environment variables as follows:
setenv JBOSS_HOME <jboss_install_location>
setenv PATH "${PATH}:/${JBOSS_HOME}/bin"
Copy the MEJB to the appropriate deploy folder. This exposes management APIs to the agent. For example, you can copy the docs/examples/jmx/ejb-management.jar file to the server/default/deploy folder or the server/all/deploy folder.
To start the JBoss Application Server, run the following command from the bin folder:
./run.sh -c <deployment profile> -b <binding address> [-Djboss.partition.name=<Partition name>]
The <deployment profile> determines the type of server instance that is started, such as standalone or JBoss partition. The <binding address> is the hostname/IP running JBoss (for example, server1.us.oracle.com). By default, the servers start as part of DefaultPartition. You can change this by specifying the <Partition name>. To start a standalone JBoss server instance, set a 'default' deployment profile. For example:
./run.sh -c default -b <binding address>
To start a JBoss partition, the JBoss Clustering service has to be enabled and the deployment profile set to 'all'. For example:
./run.sh -c all -b <binding address>
To start multiple server instances on the same host, complete the following:
Create multiple deployment profiles as per requirements.
Use a different port-set to start the individual servers. For example:
-Djboss.service.binding.set=ports-01
Note that ports-01, ports-02, ports-03, and ports-04 are predefined port-sets. The following is a sample command:
./run.sh -c node1 -Djboss.service.binding.set=ports-01 -b example.us.oracle.com
The following sections provide details on the steps involved in JBoss local discovery (agent is running on the same host) and JBoss remote discovery (agent is running on a remote host).
To enable discovery for the local agent the JNDI service should be configured and Naming Service port should be open. Furthermore, the agent should be able to communicate with the JNDI port. Host user should also have read and execute permissions over the JBOSS_HOME.
To enable JBoss remote discovery, the JNDI service should be configured and the Naming Service port should be open. In addition, the agent should be able to communicate with the host and JNDI ports, and should also have read and execute permissions on all files in the library path.
The following table provides a list of the JAR files to be copied to the agent machine (location provided as library path during discovery):
Table 23-1 JBoss JAR Files
| JBoss Version | JAR files |
|---|---|
|
JBoss 5.x |
|
|
JBoss 6.x |
|
To manually add the JBoss application server, complete the following:
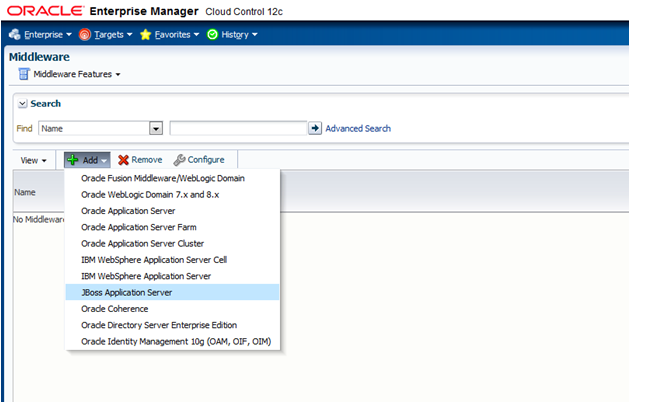
From the Enterprise Manager Targets menu, select Middleware, then click Add.
Select the JBoss Application Server from the list of options.
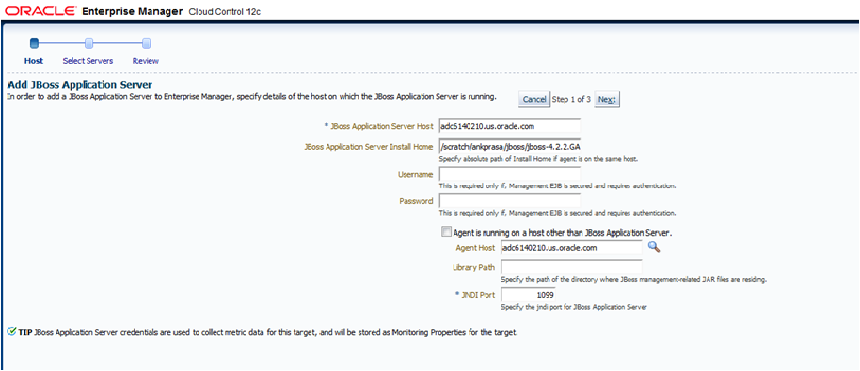
Specify the details of the host on which the JBoss Application Server is running and click Next.
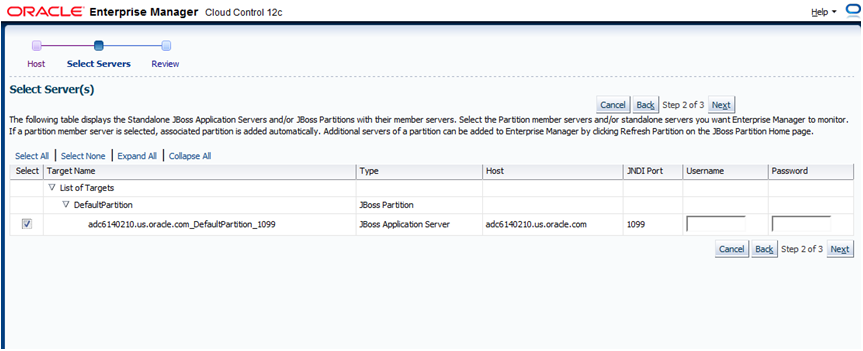
Select from the list of discovered targets (partition/servers) shown and click Next.
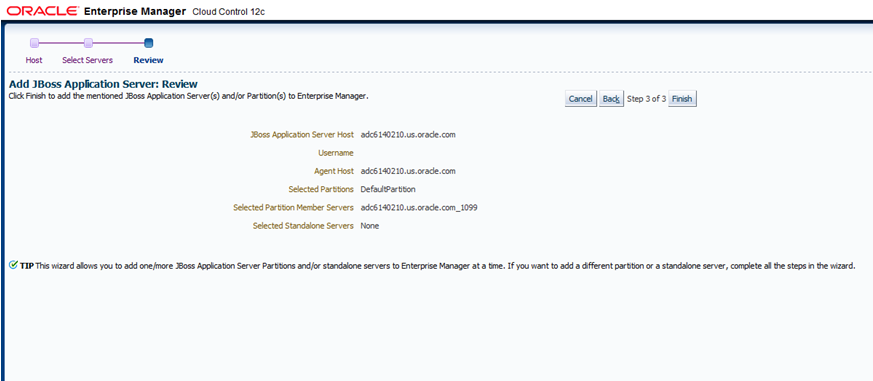
Review discovered targets to be saved and click Finish.
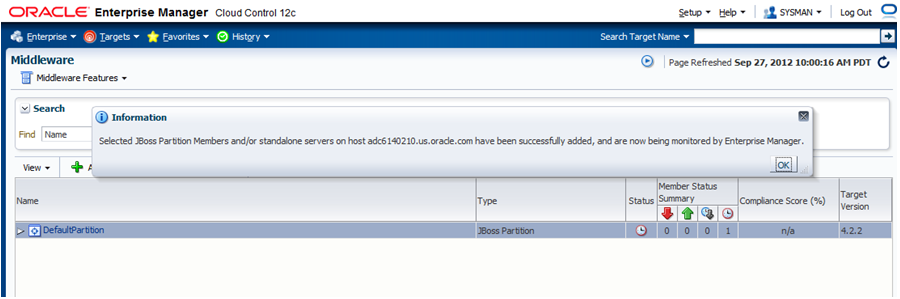
Click OK on the confirmation screen
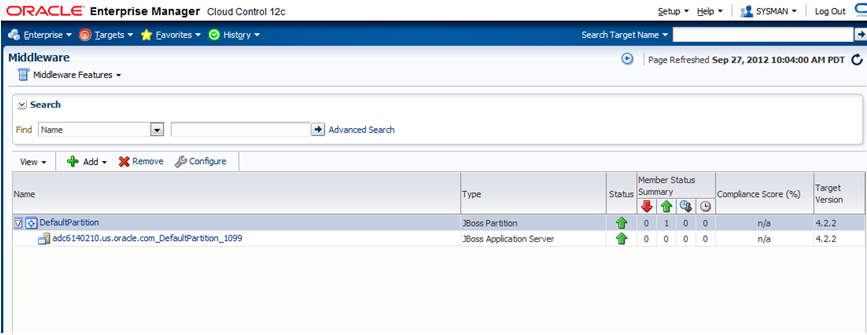
From the Enterprise Manager Targets menu, select Middleware, then verify that the Jboss target is present with status UP.
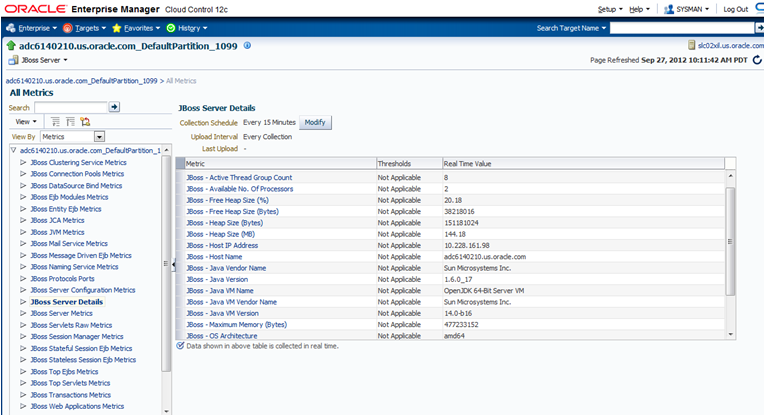
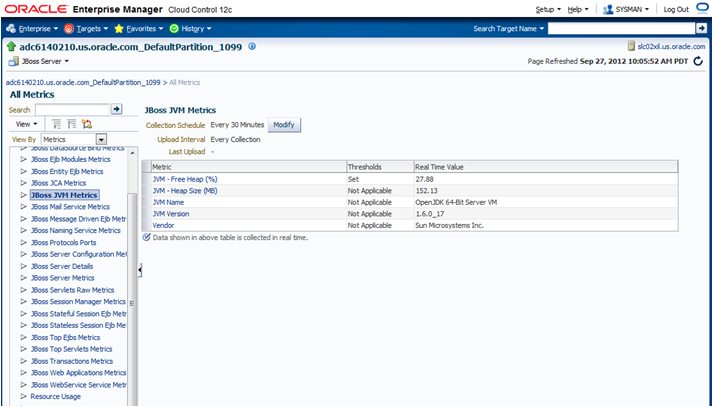
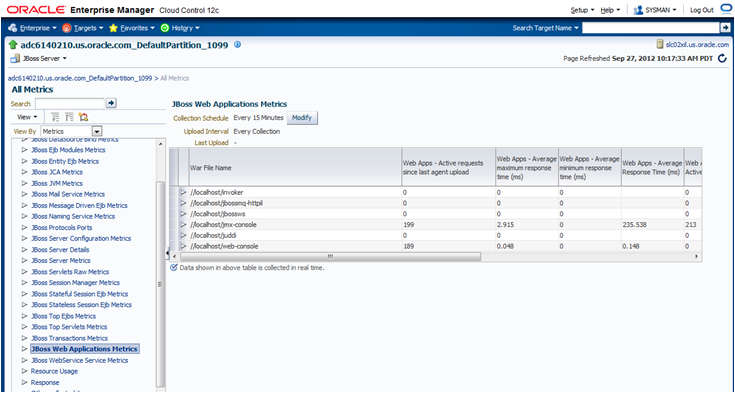
You can use the All Metrics page on Enterprise Manager to monitor the following JBoss metrics:
JBoss Server Details
JBoss JVM Metrics
JBoss Web Applications Metrics
Oracle Enterprise Manager Cloud Control 12c's JVM Diagnostics enables administrators to diagnose performance problems in Java application in the production environment. By eliminating the need to reproduce problems, it reduces the time required to resolve these problems. This improves application availability and performance.
There is a correlation between JBoss target and the JVMD/JVM target and this allows administrators to navigate to the JVM in context of a JBoss server.
To deploy JBoss on JVMD, complete the following:
Log in to Enterprise Manager
From the Setup menu, select Application Performance Management, then select JVM Diagnostic Engines.
Click Configure.
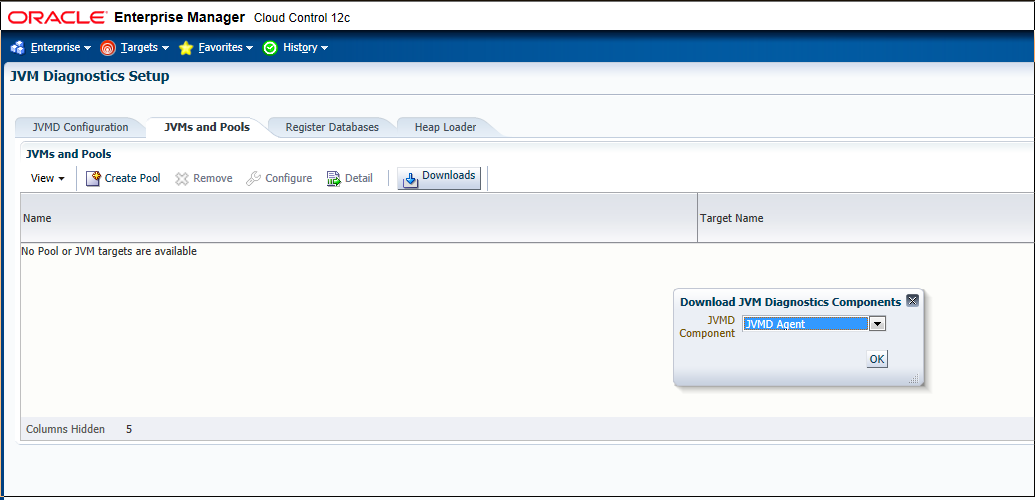
From the JVMs and Pools tab, click Downloads.
From the Download JVM Diagnostics Components window, select JVMD Agent, then click OK.
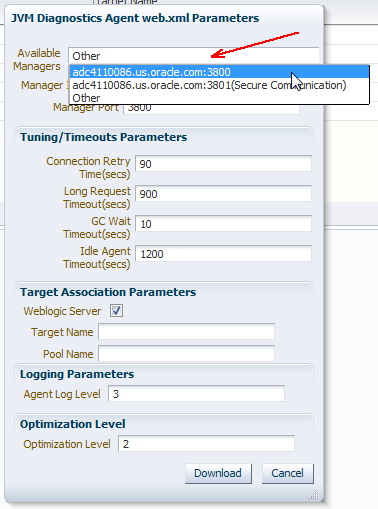
From the JVM Diagnostics Agent web.xml Parameters window, select the appropriate JVMD manager from the Available Managers list.
Uncheck the WebLogic Server checkbox, enter a pool name, then click Download.
This will download the jamagent.war file. You need to copy this file to the target machine (the machine the JBoss is running).
Copy the script contained at the following location to the same location on the target machine where the jamagent.war. file was copied:
https://stbeehive.oracle.com/content/dav/st/NonOracle%20MW/Public%20Documents/makeJAMagents.sh
Run the script passing the names of the JBoss instances (or whatever names you give to the JVM of each JBoss server). The name has to be unique for each server.
This script will create a separate jamagent WAR for each name you pass to this script.
Deploy each of these created WARs on the respective JBoss server. Typically you can use the admin console or copy the WAR file to the deploy folder.
If the hot deployment is not enabled, you may have to restart the JBoss server. Once the WAR is deployed successfully, you will see the respective JVM target on the Middleware page.
This section describes the errors you may encounter while deploying and using JBoss and the workaround steps you can follow to resolve each of them. The following topics are covered:
Target Status is Down
If the target status is DOWN after discovery, check the Monitoring properties page for Jboss Application Server and verify the following:
Local discovery: only JBoss home is present
Remote discovery: only Library path is present
Target Status is Pending
If the target status is PENDING (due to a metric collection error) after discovery, ensure that no other application server is being monitored using the same agent (such as Weblogic).
The following are the various log locations:
JBoss server logs: $JBOSS_HOME/server/<config_mode>/log
OMS logs: emoms.trc (under $OMS_HOME)
Agent logs: $AGENT_STATE_DIR/sysman/log
Useful Workarounds
In the case of JBoss discovery failure, provide the library path along with the install home and try again.
For discovery related issues, manually run the discovery script to check the output, which should look similar to the following:
java -Doracle.home=/ade/ankprasa_gc2/oracle/emagent/gcagent/agent -cp "/ade/ankprasa_gc2/oracle/emagent/gcagent/agent/lib/xmlparserv2.jar:/ade/ankprasa_gc2/oracle/emagent/gcagent/agent/jlib/emConfigInstall.jar:/ade/ankprasa_gc2/oracle/emagent/gcagent/agent/sysman/jlib/log4j-core.jar:/ade/ankprasa_gc2/oracle/emagent/gcagent/agent/modules/oracle.http_client_11.1.1.jar:/scratch/ankprasa/jboss/jboss-4.2.2.GA/client/jbossall-client.jar:/scratch/ankprasa/jboss/jboss-4.2.2.GA/server/all/lib/jbosssx.jar:/ade/ankprasa_gc2/oracle/emagent/gcagent/agent/../../plugins/oracle.sysman.emas.discovery.plugin_12.1.0.4.0/archives/em-as-thirdparty-discovery.jar" oracle.sysman.emas.thirdparty.discovery.jboss.JBossDiscovery 1099 adc6140210.us.oracle.com "EMPTY"
Troubleshooting Resources
Useful troubleshooting information can also be found by checking the following:
Monitoring Configuration page
Targets.xml on the agent
OMS and Agent logs
Agent metric browser
JBoss JMX Console
JBoss server logs
The JBoss Management Wiki
The wiki can be found at the following location:
http://aseng-wiki.us.oracle.com/asengwiki/display/ASDevEM/JBoss+Management
|
Copyright © 2011, 2013, Oracle and/or its affiliates. All rights reserved. Legal Notices |
|