| Oracle® Enterprise Manager Cloud Control Getting Started with Oracle Fusion Middleware Management 12c Release 2 (12.1.0.2) Part Number E24215-04 |
|
|
PDF · Mobi · ePub |
| Oracle® Enterprise Manager Cloud Control Getting Started with Oracle Fusion Middleware Management 12c Release 2 (12.1.0.2) Part Number E24215-04 |
|
|
PDF · Mobi · ePub |
IBM WebSphere MQ is a message oriented middleware and its primary infrastructure is queue based. Message Queue (MQ) clusters are used for high availability, and management and monitoring is supported by a command line tool, user interface, and programmable command format messages.
IBM WebSphere MQ allows administrators to derive instant value, while giving them the flexibility to fine-tune thresholds according to their specific operational requirements.
Note:
IBM WebSphere MQ code is bundled with the Oracle Fusion Middleware plug-in.The following topics are discussed in this document:
IBM WebSphere MQ offers several key benefits, including the following:
Out-of-box availability and performance monitoring
Centralized monitoring of all information in a single console
Enhanced service modeling and comprehensive root cause analysis
Out-of-Box Availability and Performance Monitoring
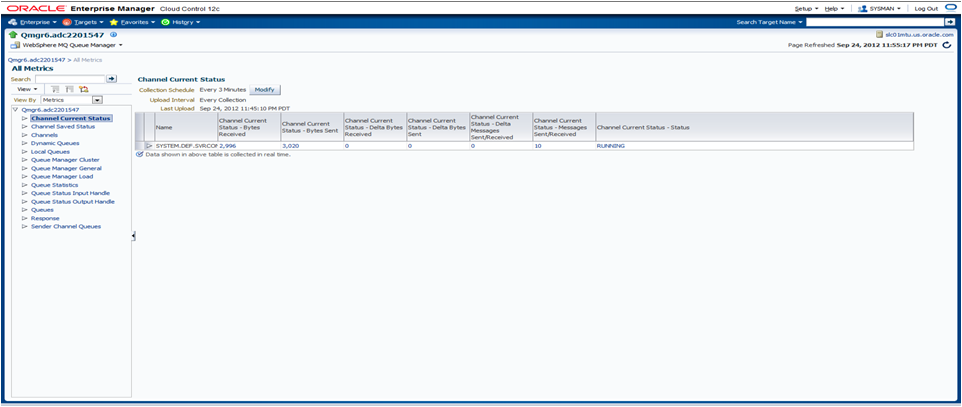
The plug-in allows you to realize immediate value through out-of-box availability and performance monitoring. Some of the key areas of the more than 60 performance indicators monitored by the plug-in include queue manager status, channel status, queue depth, bytes sent or received, and messages sent or received.
To further aid administrators with critical tasks, such as problem diagnosis, trend analysis, and capacity planning, the System Monitoring for IBM WebSphere MQ includes various out-of-box reports, summarizing key information about availability and performance. IBM WebSphere MQ System Monitoring Plug-in key features include:
Blackout Periods
Prevent unnecessary alerts from being raised during scheduled maintenance operations, such as hardware upgrade.
Monitoring Templates
Simplify the task of standardizing monitoring settings across the entire IBM WebSphere MQ environment, by allowing administrators to specify the monitoring settings (metrics, thresholds, metric collection schedules and corrective actions) once and applying them to any number of queue manager instances.
Corrective Actions
Ensure that routine responses to alerts are automatically executed, thereby saving administrators time and ensuring problems are dealt with before they noticeably impact users.
Notification Rules, Methods, and Schedules
Define when and how administrators should be notified about critical problems with their applications, ensuring quicker problem resolution.
Groups / Systems
Simplify management of large numbers of components, allowing administrators to “manage many-as-one”.
Centralized Monitoring of all Information in a Single Console
IBM WebSphere MQ provides administrators managing Oracle systems and IBM WebSphere MQ with a consolidated view of the entire enterprise, enabling them to monitor and manage all of their components from a central place.
Having such an integrated tool reduces the total cost of ownership by eliminating the need to manually compile critical information from several different tools, thus streamlining the correlation of availability and performance problems across the entire set of IT components.
In addition, System Monitoring for IBM WebSphere MQ complements existing plug-in support for host systems (requires licensing of System Monitoring Plug-in for Hosts), providing administrators with more depth and greater ability to view IBM WebSphere MQ operations directly in the context of operating system activity.
Enhance Service Modeling and Perform Comprehensive Root Cause Analysis
Oracle Enterprise Manager's Service Level Management functionality provides a comprehensive monitoring solution that helps IT organizations achieve high availability, performance, and optimized service levels for their business services. Administrators can monitor services from the end-users' perspective using service tests or synthetic transactions, model relationships between services and underlying IT components, diagnose root cause of service failure, and report on achieved service levels.
The System Monitoring Plug-in for IBM WebSphere MQ enables IT organizations running applications on top of Oracle and IBM to derive greater value from the Service Level Management features of Enterprise Manager in a number of ways:
Enhanced Service Modeling
Mapping of relationships between services and queue manager instances.
Complete Service Topology
Including IBM WebSphere MQ as part of the topology view of a service.
Comprehensive Root Cause Analysis
Identifying or excluding IBM WebSphere MQ as the root cause of service failure.
The following prerequisites must be met before installing the IBM WebSphere MQ plug-in:
Queue Manager must be running
TCP listener must be up
SYSTEM.DEF.SERVERCON channel must be available
Target discovery is performed using Grid Control Agent 10.2.0.3, so this agent must be installed and running. The agent can be installed on the same node as IBM WebSphere MQ (for Local Monitoring) or on another node in the intranet (for Remote Monitoring).
The agent must have a status UP in the Grid Control console and must upload data successfully to the Grid Control OMS (communication from the agent to the OMS). The Preferred Credentials must have been set and successfully tested for the agent node. The Host Credentials to be used for the discovery should be either the Grid Control Agent user or a user part of the same group (primary gid).
For local monitoring, the Grid Control Agent OS user should have read privileges over the following jar files, which are needed for the discovery of the target IBM WebSphere MQ:
$MQ_HOME/java/lib/com.ibm.mq.jar
$MQ_HOME/java/lib/connector.jar
$MQ_HOME/eclipse/plugins/com.ibm.mq.pcf_6.0.0/pcf.jar
Note:
MQ_HOME is the directory used to install MQ setup at installation time.For Remote Monitoring, the TCP listener port of the Queue Manager must be open to the Agent Host. The appropriate jar files must be copied on the node where the Grid Control Agent is running and the OS user starting this agent must have read privileges on these files. For example, create a directory <AGENT_ORACLE_HOME>/sysman/mq_jar_files and copy the jar files into this directory.
The following sections provide details on the jar files required to support remote monitoring from IBM Websphere MQ V6 and V7:
IMB WebSphere MQ V6
$MQ_HOME/java/lib/com.ibm.mq.jar
$MQ_HOME/java/lib/connector.jar
$MQ_HOME/eclipse/plugins/com.ibm.mq.pcf_6.0.0/pcf.jar
IBM WebSphere MQ V7
$MQ_HOME/opt/mqm/java/lib/com.ibm.mq.jar
$MQ_HOME/opt/mqm/eclipse/plugins/com.ibm.mq.pcf.event_7.0.0.1.jar
$MQ_HOME/opt/mqm/java/lib/com.ibm.mq.jmqi.jar
$MQ_HOME/opt/mqm/java/lib/com.ibm.mq.commonservices.jar
$MQ_HOME/opt/mqm/java/lib/com.ibm.mq.headers.jar
IBM WebSphere MQ supports the discovery of entire Queue Manager Clusters from a single Queue manager. Administrators can derive instant value, while giving them the flexibility to fine-tune thresholds according to their specific operational requirements. Some of the key areas of the more than 60 performance indicators being monitored, including queue manager status, channel status, queue depth, bytes sent and/or received, and messages sent and/or received.
To further aid administrators with critical tasks such as problem diagnosis, trend analysis, and capacity planning, plug-in includes various out-of-box reports, summarizing key information about availability and performance.
The following parameters are required for MQ discovery:
Host name (where the queue manager is running)
Port number
JAR path
MQ administration username
MQ administration password
Agent host
The following parameters are required for agent discovery:
Host name
Host credentials
To enable discovery for the local agent the queue manager must be running and the TCP listener must be up. In addition, the following jar files are required for discovery and should therefore be accessible to agent:
com.ibm.mq.jar (present under MQ_HOME/java/lib)
connector.jar (present under MQ_HOME/java/lib)
pcf.jar (present under MQ_HOME/eclipse/plugins/com.ibm.mq.pcf_<version>)
The Agent Host Credentials to be used for discovery should be either Oracle Agent User or should be part of the same group. The SYSTEM.DEF.SERVERCON channel should also be available.
To enable discovery for the remote agent the queue manager must be running and the TCP listener must be up. The TCP listener port of the Target Queue Manager must also be accessible to the agent. In addition, the following jar files are required for discovery and should therefore be accessible to agent:
com.ibm.mq.jar (present under MQ_HOME/java/lib)
connector.jar (present under MQ_HOME/java/lib)
pcf.jar (present under MQ_HOME/eclipse/plugins/com.ibm.mq.pcf_<version>)
The Agent Host Credentials to be used for discovery should be either Oracle Agent User or should be part of same group. The SYSTEM.DEF.SERVERCON channel should also be available.
A cluster will be discovered automatically If the queue manager is part of a cluster. To discover other members of cluster, those queue managers should be running. If the queue manager is part of more than one cluster then all clusters will be discovered.
To following points outline the logic involved in cluster discovery:
To discover the entire cluster you first discover any member of cluster
Get connection details of all other queue managers along with cluster name
If the queue manager is part of multiple clusters then repeat the step for each cluster
Connect to each queue manager using the connection details
If the queue manager is part of multiple clusters then repeat the step for each cluster
Get the name of the queue manager (queue manager should be running)
Once the cluster is added to Grid Control, you cannot explicitly remove any member queue managers from that cluster.
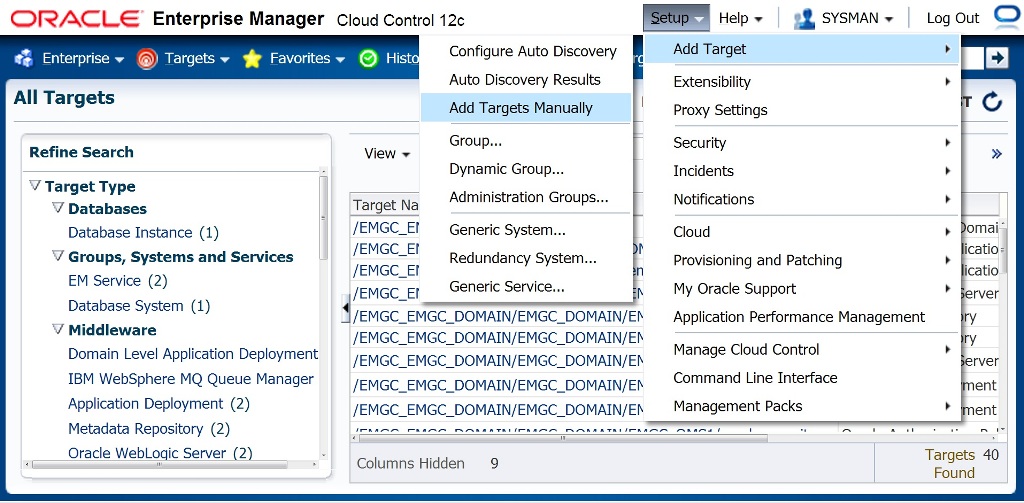
The MQ to be discovered can be either local or remote to the host where the Enterprise Manager Agent resides. To manually add targets, complete the following:
From the Enterprise Manager Setup menu, select Add Target, then select Add Target Manually.
Select the Add Targets Using Guided Process (Also Adds Related Targets) option.
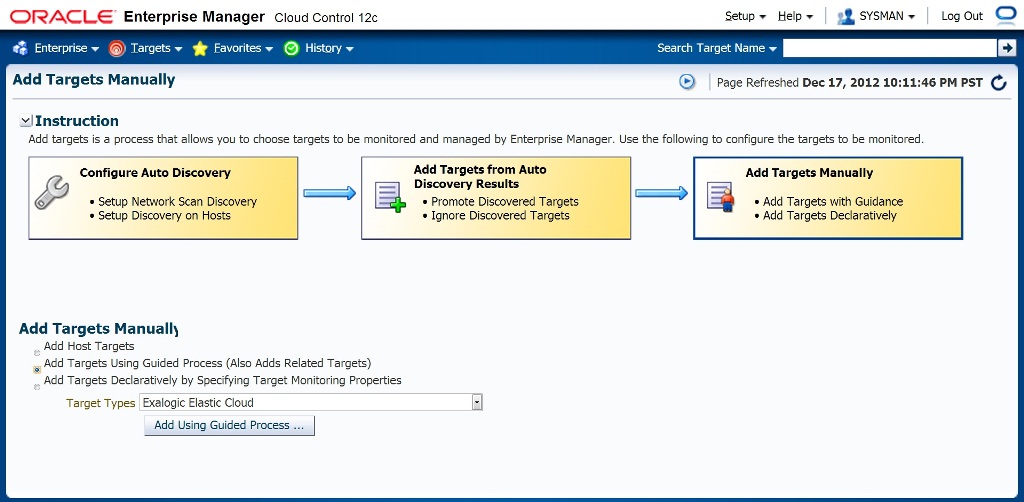
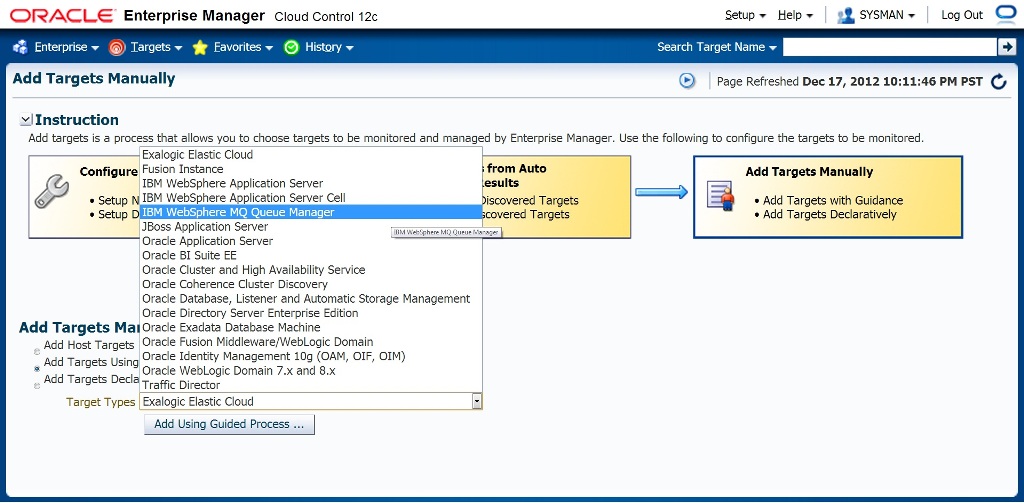
Select IBM WebSphere MQ Queue Manager from Target Types and click Add Using Guided Process....
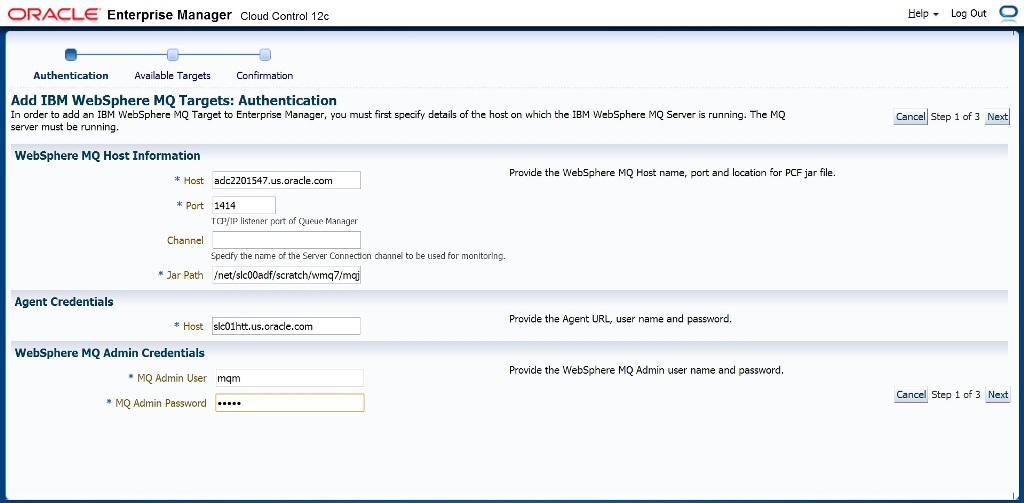
Provide the following required information for discovery and click Next.
Host on which IBM MQ is running.
Port number of the queue manager you want to discover (associated cluster and all queue manager in this cluster will also be discovered).
Jar path location (location must be accessible to the OEM agent).
Provide the agent host details used to monitor IBM WebSphere MQ.
MQ administration credentials.
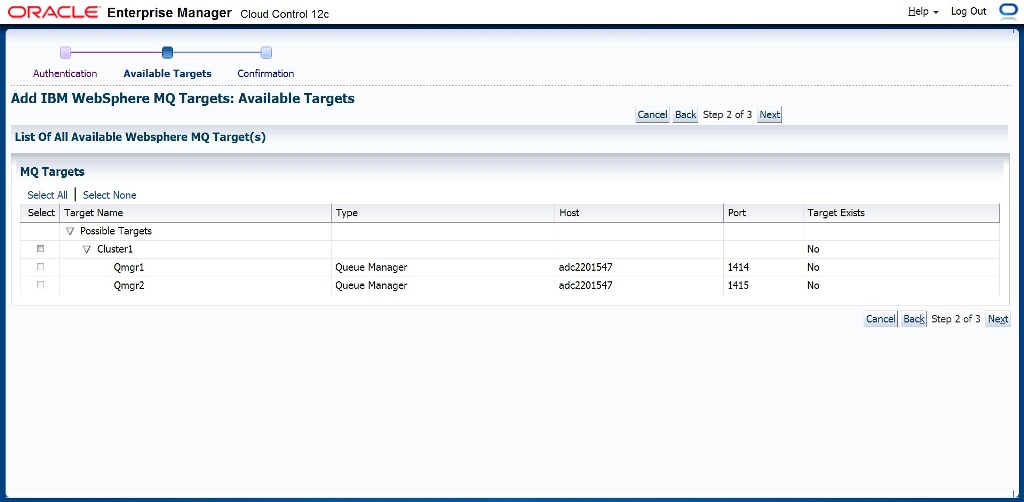
Select the cluster you want to discover and click Next.
The following image shows a Queue Manager cluster:
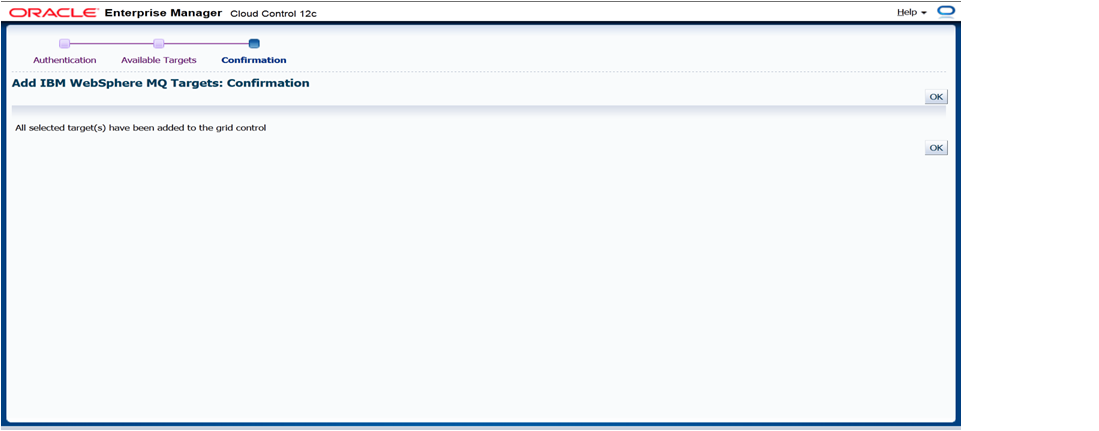
Click OK to finish discovery.
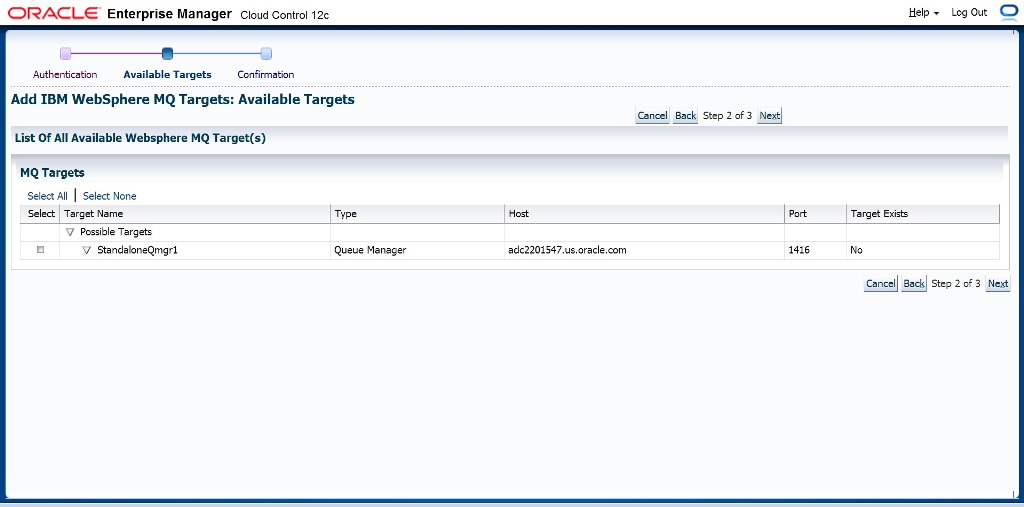
Standalone queue manager discovery is also supported. The steps to manually add a standalone queue manager are the same as those described for cluster queue manager discovery. see Queue Manager Cluster Discovery for more information. The only difference is that you select a standalone queue manager from the list of possible targets on the Add IBM WebSphere MQ Targets: Available Targets page, as shown below:
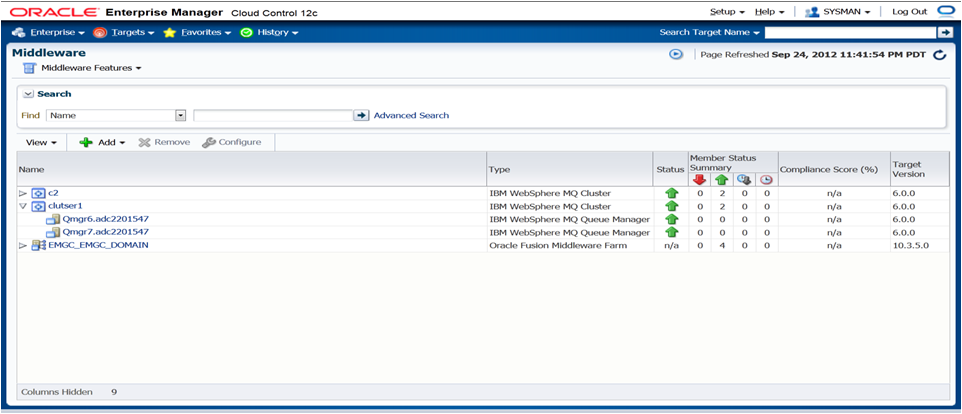
The following illustrates some of the different methods used to monitor the performance of the IBM WebSphere MQ plug-in:
Middleware page displaying the discovered IBM MQ clusters and queue-managers.
Cluster page displaying information about a cluster.
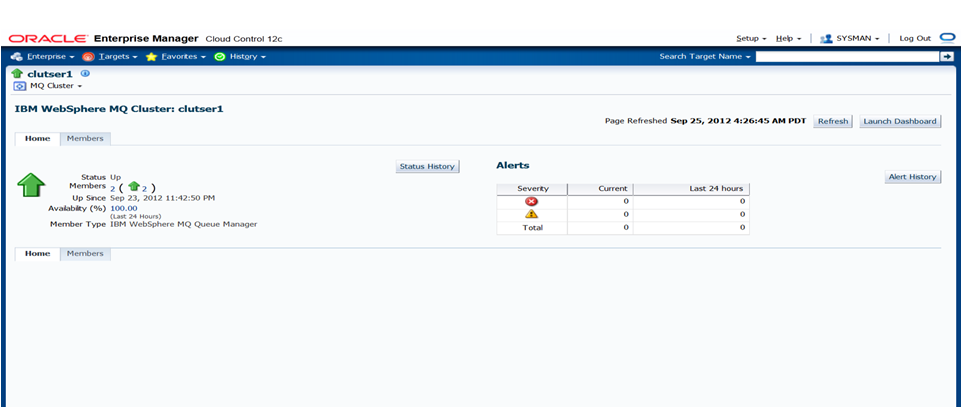
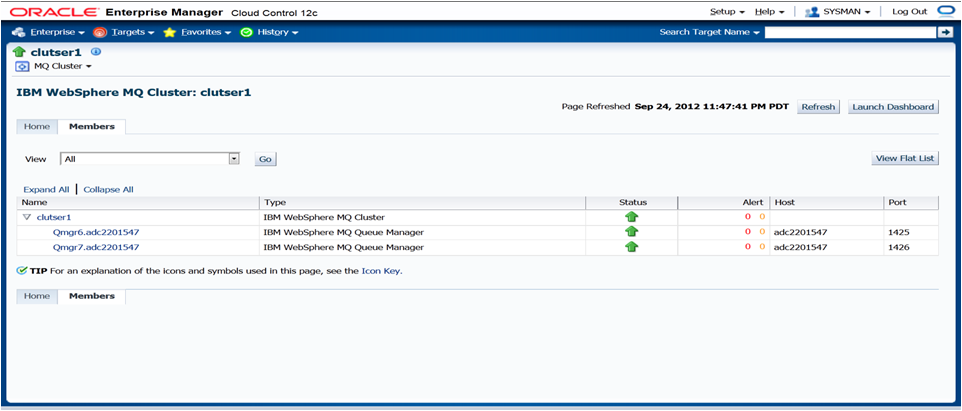
Cluster Member's page displaying information about members of the cluster.
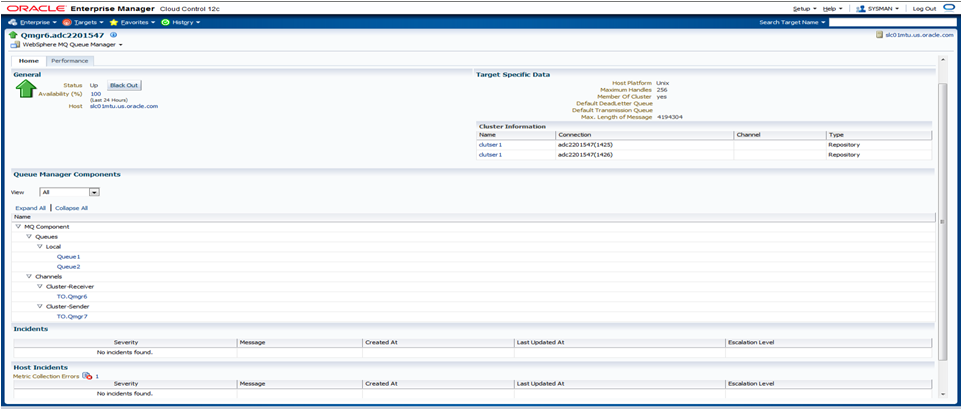
Queue-Manager page displaying information about queues and channels.
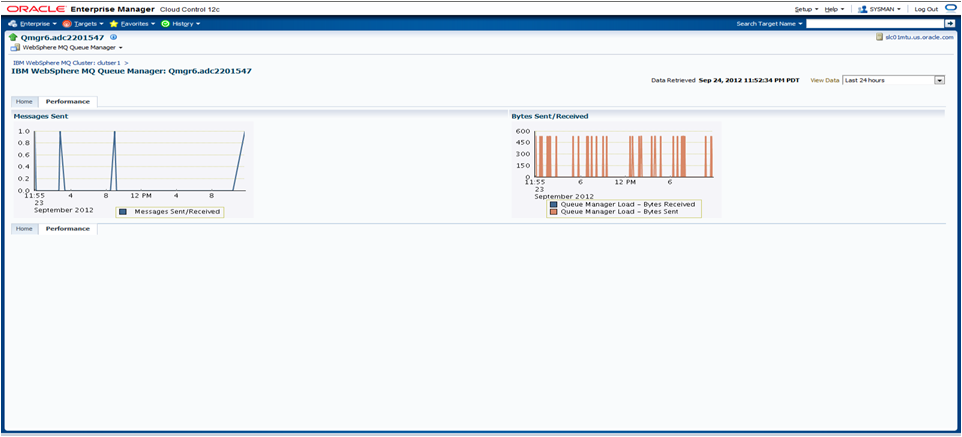
Queue-manager performance page displaying information about messages.
All metric page for the IBM MQ plug-in displaying all the metrics collected.
Queue page displaying information about queues discovered.
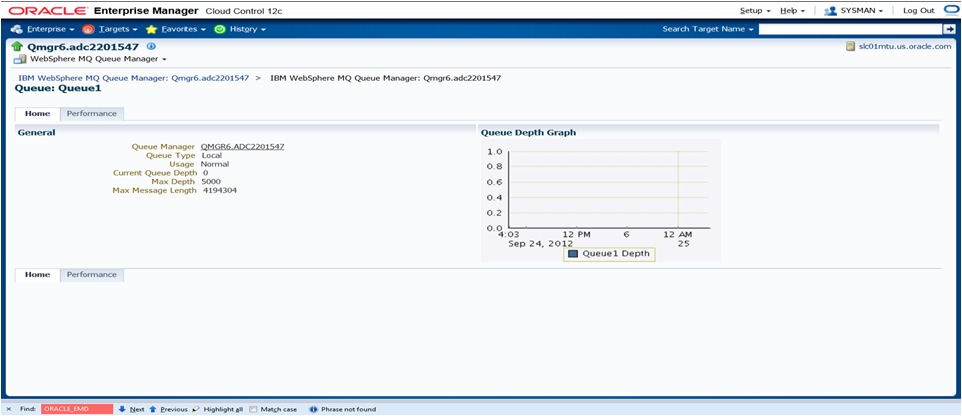
Queue performance page displays various information about queue.

For information on all IBM WebSphere MQ metric categories, including tables that list and describe associated metrics for each category, see the IBM WebSphere MQ Metrics chapter in Oracle® Enterprise Manager System Monitoring Plug-in Metric Reference Manual for Non-Oracle Middleware Management. This can be found at the following location:
http://docs.oracle.com/cd/E11857_01/em.111/e10115/middleware_mq.htm#sthref127
|
Copyright © 2011, 2013, Oracle and/or its affiliates. All rights reserved. Legal Notices |
|