Using the Actions Menu
You can customize an interactive report by selecting options on the Actions menu.
Not all options described in this section are available on every Actions menu. Developers can customize what options appear. To learn more, see "Customizing the Interactive Search Bar" in Oracle Application Express Application Builder User's Guide.
Topics:
About the Actions Menu
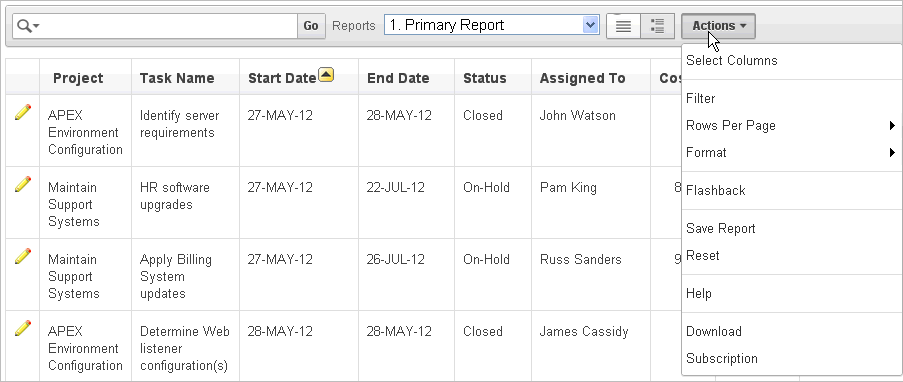
The Actions menu appears to the right of the Go button on the Search bar. Use this menu to customize an interactive report.
The Actions menu contains the following options:
-
Select Columns specifies which columns to display and in what order. See "Selecting Columns to Display".
-
Filter focuses the report by adding or modifying the filter clause on the query. See "Adding a Filter".
-
Rows Per Page determines how many rows display in the current report. See "Specifying Rows Per Page".
-
Format contains the following submenu:
-
Sort - Changes the columns to sort on and determines whether to sort in ascending or descending order. See "Selecting Column Sort Order".
-
Control Break - Creates a break group on one or several columns. This pulls the columns out of the interactive report and displays them as a master record. See "Creating a Control Break".
-
Highlight - Defines a filter that highlights the rows that meet the filter criteria. See "Adding Highlighting".
-
Compute - Enables users to add computed columns to a report. See "Computing Columns".
-
Aggregate - Enables users to perform mathematical computations against a column. See "Aggregating a Column ".
-
Chart - Displays the report data as a chart. See "Creating a Chart from the Actions Menu".
-
Group By - Enables users to group the result set by one or more columns and perform mathematical computations against columns. See "Grouping Columns".
-
-
Flashback - Enables users to view the data as it existed at a previous point in time. See "Executing a Flashback Query".
-
Save Report - Saves the interactive report. Depending upon their user credentials, users can save different types of reports. See "Saving an Interactive Report".
-
Reset - Resets the report back to the default report settings. See "Resetting a Report".
-
Help - Provides descriptions of how to customize interactive reports.
-
Download - Downloads a report. Available download formats depend upon your installation and report definition. See "Downloading a Report".
-
Subscription - Send an interactive report by email. See "Subscribing to Emailed Reports"
Selecting Columns to Display
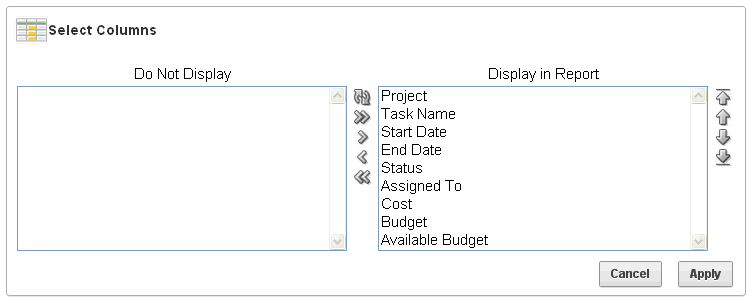
To customize a report to include specific columns, select Select Columns on the Actions menu.
To use the Select Columns option:
-
Click the Actions menu and select Select Columns.
The Select Columns region appears.
-
Select the columns you want to move. Click the center arrows to move a column from Display in Report to Do Not Display. To select multiple columns at once, press and hold the CTRL key.
-
To change the order of the columns, click the Top, Up, Down, and Bottom arrows on the right.
-
Click Apply.
A revised report appears.
Adding a Filter
You can create a filter on an interactive report by adding or modifying the WHERE clause on the query. You can create two types of filters:
-
Column - Creates a custom column filter. Select a column, select a standard Oracle operator (
=,!=,not in,between), and enter an expression to compare against. Expressions are case sensitive. Use the percent sign (%)as a wildcard. Note that the selected column does not need to be one that currently displays. For example:STATE_NAME like A%
-
Row - Creates a custom row filter. This filter creates a complex
WHEREclauses using column aliases and any Oracle functions or operators. For example:G = 'VA' or G = 'CT'
Where
Gis the alias forCUSTOMER_STATE.
Adding a Column Filter
To add a column filter:
-
Click the Actions menu and select Filter.
The Filter region appears.
-
For Filter Type, select Column.
-
In the Filter region, specify a column, an operator, and an expression.
This example narrows the display to Discussion Forum projects.
-
Click Apply.
Notice the filter
Project = 'Discussion Forum'displays in the Report Settings area above the report. -
To revise the filter:
-
Click the filter name (in this example,
Project = 'Discussion Forum'). -
Edit your selections and click Apply.
-
-
To disable the filter, select the Enable/Disable Filter check box.
-
To delete the filter, click Remove Filter.
Adding a Row Filter
To add a row filter:
-
Click the Actions menu and select Filter.
The Filter region appears.
-
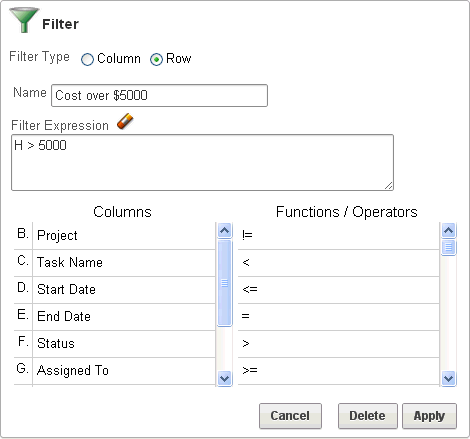
For Filter Type, select Row.
-
In the Filter region:
-
Name - Enter a name that describes this filter.
-
Filter Expression - Enter an expression. Select a column and function or operator at the bottom of the region.
-
-
Click Apply.
The Row Filter narrows the display to projects with a cost of more than $5000.
-
To revise the filter:
-
Click Row Filter.
-
Edit your selections and click Apply.
-
-
To disable the filter, select the Enable/Disable Filter check box.
-
To delete the filter, click Remove Filter.
Specifying Rows Per Page
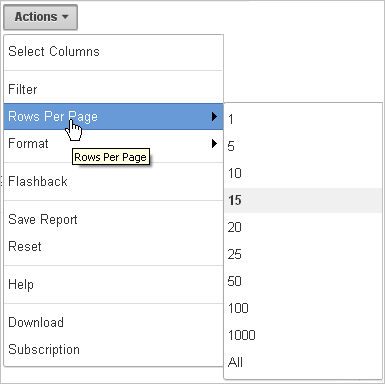
You can specify the number of rows that display on a page by selecting Rows Per Page on the Actions menu.
To specify the number of rows that display:
-
Click the Actions menu and select Rows Per Page.
-
From the submenu, select a number.
Selecting Column Sort Order
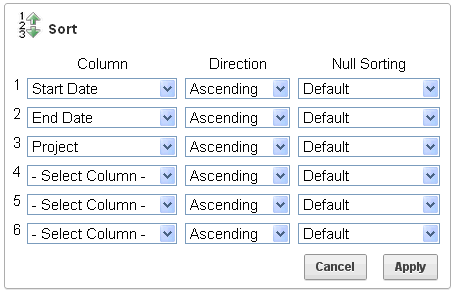
You can specify column display sort order (ascending or descending) by selecting Sort on the Format submenu. You can also specify how to handle NULL values. Using the default setting always displays NULL values last or always displays them first.
To sort by column:
-
Click the Actions menu and select Format and then Sort.
The Sort region appears.
-
Select a column, the sort direction (Ascending or Descending), and Null Sorting behavior (Default, Nulls Always Last, or Nulls Always First).
-
Click Apply.
Creating a Control Break
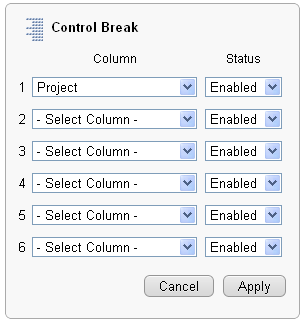
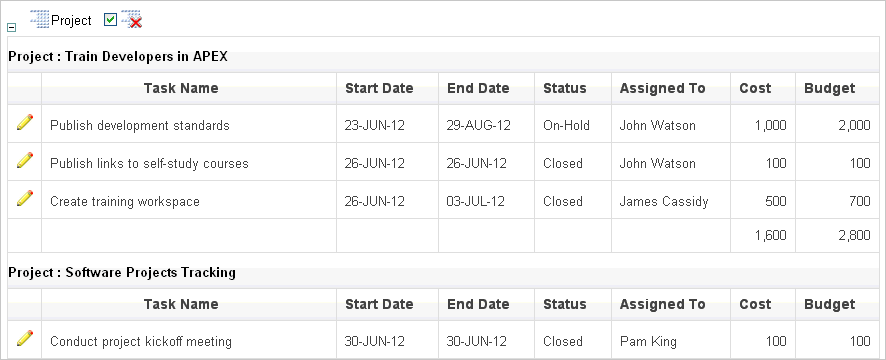
You can create a break group of one or several columns by selecting Control Break from the Actions, Format submenu. Creating a break group pulls the columns out of the interactive report and displays them as a master record.
To create a break group:
-
Click the Actions menu and select Format and then Control Break.
The Control Break region appears.
-
Select a column and then a status (Enable or Disable)
-
Click Apply.
A revised report displays.
Note the defined break groups display in the Report Settings area above the report.
-
To disable the Control Break filter, deselect the Enable/Disable Filter check box. To enable the filer, select the Enable/Disable Filter check box again.
-
To delete the filter, click Remove Breaks.
Adding Highlighting
You can customize the display to highlight specific rows in a report by selecting Highlight on the Actions, Format submenu.
To add highlighting:
-
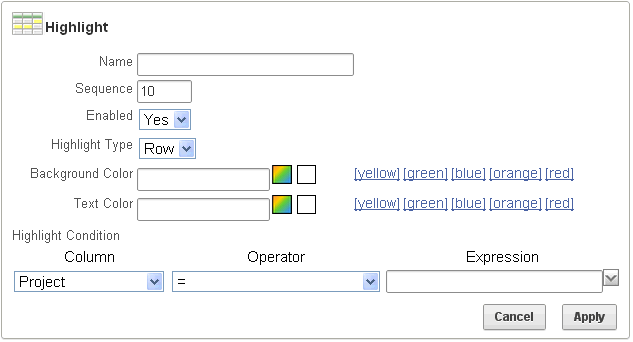
Click the Actions menu and select Format and then Highlight.
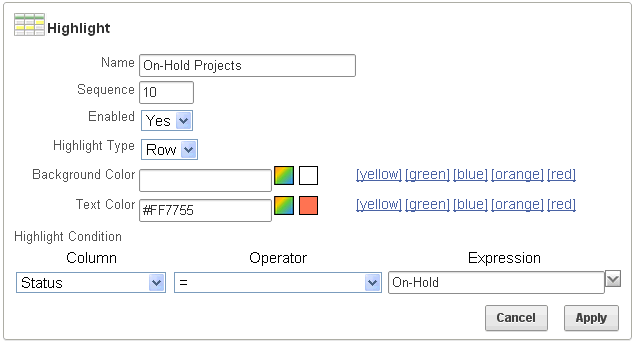
The Highlight region appears.
-
Edit the following information:
-
Name - Enter a name that describes this filter.
-
Sequence - Enter a numeric value to identify the sequence in which highlighting rules are evaluated.
-
Enabled - Select Yes.
-
Highlight Type - Select Cell or Row.
-
Background Color - Select a new color for the background of the highlighted area.
-
Text Color - Select a new color for the text in the highlighted area.
-
Highlight Condition - Select a column, an operator, and expression.
-
-
Click Apply.
Note the highlight
On-Hold Projectsdisplays in the Report Settings area above the report. -
To revise the highlight, click the highlight name and make the following edits:
-
Background Color - Select yellow.
-
Text Color - Select green.
-
Click Apply.
-
-
To disable the highlight, select the Enable/Disable check box.
-
To delete the highlight, click Remove Highlight.
Computing Columns
You can add computations to columns by selecting Compute from the Actions, Format submenu. These computations can be mathematical computations (for example, NBR_HOURS/24) or standard Oracle functions applied to existing columns.
To create a computation:
-
Click the Actions menu and select Format and then Compute.
The Compute region appears.
-
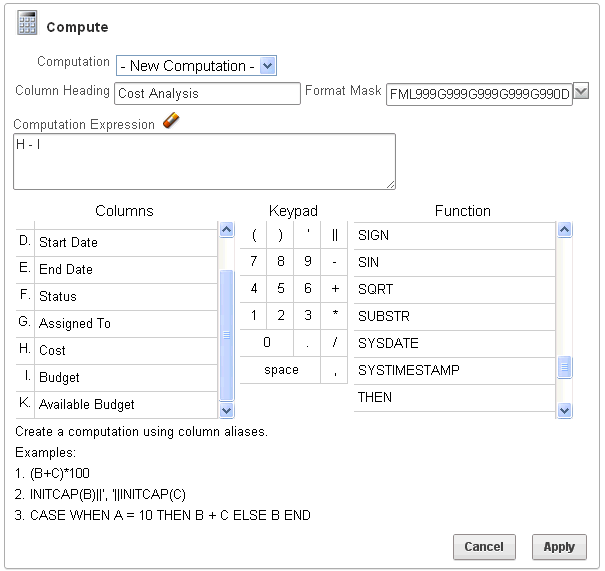
In the Compute region:
-
Computation - Select New Computation.
-
Column Heading - Enter the name of the new column to be created.
-
Format Mask - Select an Oracle format mask to be applied to the new column. (for example,
$9999).Next, create the computation.
-
Create the computation:
-
Columns - Select a column or alias.
-
Keypad - Select a shortcut for commonly used keys.
-
Functions - Select the appropriate function.
In the following example, a new column compares the actual cost to the budgeted amount, using the formula
H - I, whereHis the cost andIis the budgeted amount. -
-
-
Click Apply.
The revised report appears containing a new Cost Analysis column.
Deleting a Computation
To delete a computation:
-
Click the Actions menu and select Format and then Compute.
The Compute region appears.
-
From Computation, select a computation.
The computation appears.
-
Click Delete.
Aggregating a Column
You can define an aggregation against a column by selecting Aggregate from the Actions, Format menu. Aggregates are displayed after each control break and at the end of the report within the column for which they are defined.
To aggregate columns:
-
Click the Actions menu and select Format and then Aggregate.
The Aggregate region appears.
-
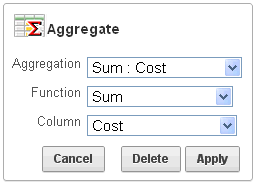
In the Aggregate region:
-
Aggregation - Select New Aggregation.
-
Function - Select one of the following: Sum; Average, Count, Count Distinct, Minimum, Maximum, or Median.
-
Column - Select a column.
This example creates a sum of the Cost column.
-
-
Click Apply.
The computation appears at the bottom of the report.
In this example, the aggregate shows the sum of all amounts in the Cost column.
Removing an Aggregate
To remove aggregate columns:
-
Click the Actions menu and select Format and then Aggregate.
The Aggregate region appears.
-
From Aggregation, select a previously defined aggregation.
-
Click Delete.
Creating a Chart from the Actions Menu
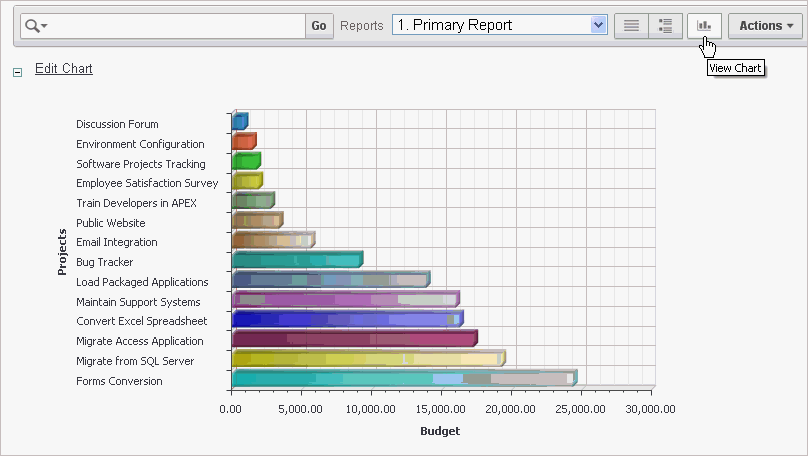
To create a chart, select Chart on the Actions, Format menu. You can create one chart for each interactive report. Once defined, you can switch between the chart and report views using links on the Search bar.
To create a chart:
-
Click the Actions menu and select Format and then Chart.
The Chart region appears.
-
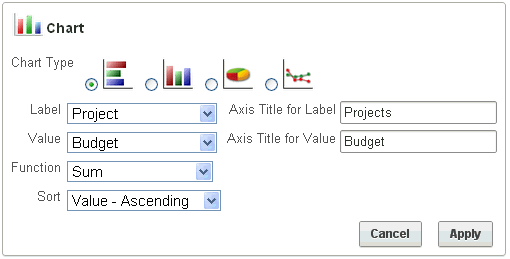
In the Chart region, specify the appropriate options.
The following attributes are for bar charts:
-
Chart Type - Select the type of chart you want to create (horizontal bar, vertical bar, pie, or line.).
-
Label - Select the column to be used as the label.
-
Axis for Title for Label - Enter the title to display on the axis associated with the column selected for Label (not available for pie chart).
-
Value - Select the column to be used as the Value. If your function is a
COUNT, a Value does not need to be selected. -
Axis Title for Value - Enter the title to display on the axis associated with the column selected for Value (not available for pie chart).
-
Function - (Optional) Select a function to be performed on the column selected for Value.
-
Sort - Select a sorting method.
-
-
Click Apply.
The chart appears.
Note the Search bar now contains two icons: View Report and View Chart.
-
Click these icons to toggle between chart and report views.
Editing a Chart
To edit a chart:
-
While viewing a report:
-
Click the Actions menu and select Format and then Chart.
The Chart region appears.
-
Edit your selections and click Apply.
-
-
While view the chart:
-
Click Edit Chart.
-
Edit your selections and click Apply.
-
Deleting a Chart
To delete a chart:
-
While viewing a report:
-
Click the Actions menu and select Format and then Chart.
The Chart region appears.
-
Click Delete.
-
-
While viewing a chart:
-
Click Edit Chart.
-
Click Delete.
-
Grouping Columns
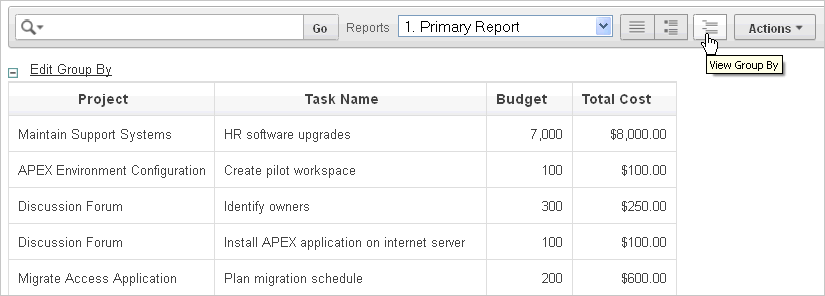
Group By enables users to group the result set by one or more columns and perform mathematical computations against the columns. Once users define the group by, they can switch between the group by and report views using the View Icon on the Search bar.
Topics:
Creating a Group By
To use Group By:
-
Click the Actions menu and select Format and then Group By.
The Group By region appears.
-
From Group by Column, select up to three columns to display.
-
To include a computation, select the function, column, label, and format mask.
-
To specify sorting, select a sort column, sort direction, and preferences for NULL values.
-
Click Apply.
A Group By icon appears below the Search bar. The resulting report displays the Project, Task Name, and Budget columns. Additionally, a new column, Total Cost, displays on the right side.
Editing a Group By
To edit a group by:
-
Click Edit Group By.
The Group By region appears.
-
Edit the attributes.
-
Click Apply.
Deleting a Group By
To delete a group by:
-
Click Edit Group By.
The Group By region appears.
-
Click Delete.
Selecting a Group By Sort Order
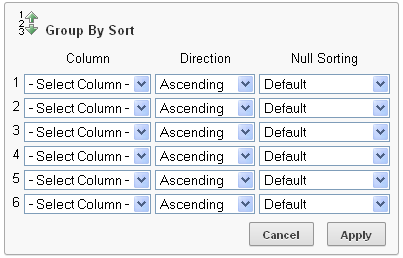
You can specify group by column sort order (ascending or descending) by either clicking on the group by column heading or selecting Group By Sort on the Format submenu. You can also specify how to handle NULL values. Using the default setting always displays NULL values last or always displays them first.
To sort a group by column:
-
Access a Group By view. See "Creating a Group By".
-
Click the Actions menu and select Format and then Group By Sort.
The Group By Sort region appears.
-
Select a column, the sort direction (Ascending or Descending), and Null Sorting behavior (Default, Nulls Always Last, or Nulls Always First).
-
Click Apply.
Executing a Flashback Query
You can execute a flashback query by selecting Flashback from the Actions menu. A flashback query enables you to view the data as it existed at a previous point in time. The default amount of time that you can flashback is 3 hours (or 180 minutes) but the actual amount is different for each database.
To execute a flashback query:
-
Click the Actions menu and select Flashback.
-
In the Flashback region, enter the number of minutes.
-
Click Apply.
Saving an Interactive Report
As an end user, you can save a private or public interactive report. Only the user who creates a private report can view, save, rename, or delete it. The following shows the Reports list on the Search bar of an interactive report.
This example shows two reports:
-
Default - Primary Report. This is the initial report created by the application developer. Default, Primary reports cannot be renamed or deleted.
-
Private - 1. Control Break. This is a Private report. Only the user who creates a private report can view, save, rename, or delete it.
Topics:
About Configuration Dependencies
The ability to save an interactive report is configurable by your application developer. To learn more, see "Customizing the Search Bar" and "Saving an Interactive Report" in Oracle Application Express Application Builder User's Guide.
Saving a Public or Private Interactive Report
End users can save an interactive report and classify it as being either:
-
Public. The report can be saved, renamed, or deleted by the end user who created it. Other users can view and save the layout as another report.
-
Private. Only the end user that created the report can view, save, rename or delete the report.
To save a public or private interactive report:
-
Go to the page containing the interactive report you want to save.
-
Customize the report (for example, hide columns, add filters, and so on). See "Using the Actions Menu".
-
Click the Actions menu and select Save Report.
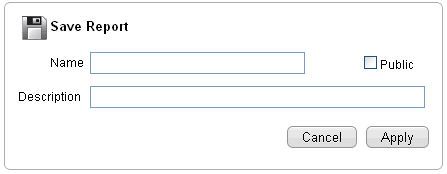
The Save Report region appears.
-
In Save Report:
-
Name - Enter a name for the report.
-
Description - Enter an optional description.
-
Public - Select this check box to make the report viewable to all users. Deselect this check box to make the report private.
The ability to save an interactive report as Public is determined by your application developer. See "About Configuration Dependencies".
-
Click Apply.
-
Renaming a Public or Private Interactive Report
To rename a public or private interactive report:
-
Run the report as a developer.
-
Select a public or private interactive report to rename.
-
Click the Rename Report link.
-
Edit the attributes (for example, enter a new name).
-
Click Apply.
Deleting a Public or Private Interactive Report
To delete a public or private interactive report:
-
Run the report as a developer.
-
Click the Delete Report icon next to the report name link.
-
Click Apply.
Resetting a Report
You can reset a report back to the default settings by selecting Reset from the Actions menu. Resetting a report removes any customizations you have made.
To reset a report:
-
Click the Actions menu and select Reset.
-
Click Apply.
Downloading a Report
You can download an interactive report back by selecting Download from the Actions menu. Available download formats depend upon your installation and report definition. Supported formats include comma-delimited file (CSV) format, HTML, Email, Microsoft Excel (XLS) format, Adobe Portable Document Format (PDF), and Microsoft Word Rich Text Format (RTF).
The ability to download an interactive report is configurable by your application developer. To learn more about configuring download options, see "Configuring Download Options on the Actions Menu" in Oracle Application Express Application Builder User's Guide.
To download a report:
-
Click the Actions menu and select Download.
-
Select a report download format and follow the provided instructions.
Subscribing to Emailed Reports
End users can receive updated versions of a report by subscribing to it. To subscribe to a report, click Subscription on the Actions menu. Emails sent from an interactive report contain a system generated email signature that cannot be overwritten that identifies who originated the email.
To utilize Subscription:
-
An Oracle Application Express administrator must configure email at the Instance level.
-
The application developer must enable the Subscription check box on the Interactive Report Attributes page. See "Customizing the Interactive Report Search Bar" in Oracle Application Express Application Builder User's Guide.
To receive updated report results by email:
-
Click the Actions menu and select Subscription.
The Add Subscription region appears.
-
Under Add Subscription:
-
Email Address - Enter the email addresses to receive the report. To include multiple email addresses, separate each email address with a comma.
-
Subject - Enter text to display in the email subject line.
-
Frequency - Select the interval at which the report is sent.
-
Starting From - Select a start date and time.
-
Ending - Select an end date and time. Select a day, week, month, or year.
-
Click Apply.
-
Emails sent from a subscription include a system generated email signature indicating who created the subscription. This signature cannot be removed.
"Managing Interactive Report Subscriptions" in Oracle Application Express Administration Guide
