23 Monitoring OAAM Administrative Functions and Performance
There are several methods to view performance metrics.
This chapter contains the following sections:
23.1 Monitoring Performance Data and Administrative Functions Using the Oracle Adaptive Access Manager Dashboard
This section introduces you to the dashboard and how it is used.
23.1.1 What is a Dashboard?
The Oracle Adaptive Access Manager Dashboard is an application that provides a high-level view of real monitor data. Monitor data is a representative sample of data.
It presents a real-time view of activity via aggregates and trending.
The Dashboard is comprised of three sections that enable you to focus your review on relevant data, such as the following:
-
Performance statistics
-
Expanded summary data
-
Statistics based on location, scoring, device, security, and performance
Dashboard reports that are presented help you visualize and track trends. With a dashboard report you could check the frauds/alerts in your system. The dashboard also helps you make decisions based on user/location/devices profile allowing easy identification of risks taking place in the system.
The level of access to the dashboard (user interface views and controls) is based according to roles and company requirements.
23.1.2 Common Terms and Definitions
This section contains common dashboard terms and definitions.
Table 23-1 Common Dashboard Terms and Definition
| Term | Definition |
|---|---|
|
Refresh |
Rate to update Dashboard with new data. The choices are 30 seconds, 1 minute, and 10 minutes. |
|
Performance Panel |
Section 1 of the Dashboard shows real-time data. |
|
Summary Panel |
Section 2 of the Dashboard shows aggregate data. |
|
Dashboard Panel |
Section 3 of the Dashboard shows historical data. |
|
Data type |
Type of information in the Oracle Adaptive Access Manager system. |
|
Range |
Time frame. The choices are Today, Last 1 day, Last 7 days, Last 30 days, and Last 90 days. |
|
Average Process Time |
Average number of milliseconds for execution. |
|
Blocked Transactions |
Transactions that were blocked during the transaction checkpoint. |
|
High Alert (Logins) |
High level alerts triggered during the login checkpoint. |
|
High Alert (Transactions) |
High level alerts triggered during the transaction checkpoint. |
|
KBA Challenges |
Challenge question responses. |
|
OTP Challenges |
OTP challenge responses |
23.1.3 Navigation
In the Navigation tree, double-click Dashboard. The Dashboard will appear in the OAAM Administration Console's right side.
The dashboard is divided into three sections:
-
The performance panel (Section 1) presents real-time data. It shows the performance of the traffic that is entering the system. A trending graph is shown of the different types of data based on performance.
-
The summary panel (Section 2) presents aggregate data based on time range and different data types.
-
The dashboard panel (Section 3) presents historical data. The detailed dashboards are used for trending data over time ranges.
23.1.4 Using the Dashboard in Oracle Adaptive Access Manager
The Oracle Adaptive Access Manager Dashboard uses real-time data to provide a quick, overview of users and devices that have generated alerts and of all alerts by geographic location. It displays different levels of security to help you analyze online traffic, identify suspicious behavior, and design rules for fraud prevention. The dashboard also offers both total time views and trending views of performance levels.
23.1.4.1 Performance
This section provides information on viewing the total view and trending views.
23.1.4.1.1 Viewing Statistics in Total View and Trending View
The Performance panel (Section 1) displays a total view on the left and a trending view on the right.
-
The total view shows the statistics on the current volume or rate of logins at the present time versus the maximum.
Max - the maximum number of logins per minute
Current - the current number of logins per minute
-
The trending view provides statistics on the selected data (how the data progresses) during the past hour.
23.1.4.1.2 Viewing Performance Data
To view the performance data:
-
Select the data type you want from the Data list.
The data types provided are:
Table 23-2 Performance Data Types
Data Type Definition Logins per minute
Number of successful login per minute
KBA challenges per minute
Number of challenge question responses per minute
OTP challenges per minute
Number of OTP challenge responses per minute
Blocked logins per minute
Number of blocked logins per minute
Blocked transactions per minute
Number of blocked transactions per minute
Transactions per minute
Number of successful transactions per minute
High Alerts (Logins) per minute
Number of high alerts triggered during the login checkpoint per minute
High Alert (Transactions) per minute
Number of high alerts triggered during the transaction checkpoint per minute
-
To select more than one data type, control-click the types you want.
Note: The Performance panel is intended for viewing between 1 and 3 data points at a time.
-
To change the refresh rate, select the refresh rate from the Refresh list.
Graphs are shown in different colors, which are generated on the fly, to distinguish the data schemes that are represented.
The performance panel also provides tooltips so that you can view more detailed information about the data points you are interested in. To view information using tooltips, move the mouse to the desired data point.
23.1.4.1.3 Difference Between Performance Panel and Performance Dashboard
The Performance panel (Section 1) displays real-time interpolations that are updated at the selected rate. The numbers displayed are not totals even though they may correspond numerically to totals in many instances.
The Performance dashboard is one of the five detailed dashboards in Section 3. Section 3 provides accurate totals and trends them over time.
A good analogy to the difference between these two views is a speedometer. Section 1 is like a speedometer. While driving, a speedometer may display 60 m.p.h. This does not mean that during the hour you have traveled 60 miles. In reality you, would have traveled 25 miles if the speed fluctuated or you stopped for gas. If Section 1 shows the rate at which you are traveling, Section 3 shows your actual distance traveled.
23.1.4.2 Summary
The Summary panel displays an overview or aggregate of the selected data type for the specified range or time fame.
Table 23-3 presents the data types in the Summary panel.
| Data Type | Definition |
|---|---|
|
Login Sessions |
Login sessions |
|
Success Logins |
Successful logins |
|
Temporary Allow Logins |
Logins that occurred while a temporary allow was active |
|
Blocked Logins |
Logins that were blocked during the login checkpoint |
|
High Alert (Logins) |
High level alerts triggered during the login checkpoint |
|
KBA Challenges |
Challenge question responses |
|
OTP Challenges |
OTP challenge responses |
|
Transaction Sessions |
Transaction ID |
|
Success Transactions |
Successful transactions |
|
Blocked Transactions |
Transactions that were blocked during the transaction checkpoint. |
|
High Alert (Transactions) |
High level alerts triggered during the transaction checkpoint |
|
Average Rule Process Time |
Average number of milliseconds for rule execution |
|
Average Policy Process Time |
Average number of milliseconds for policy execution |
|
Average Checkpoint Process Time |
Average number of milliseconds for checkpoint execution |
To select a data type, click the one you want from the Data list.
To select more than one data type, control-click the types you want.
To change the refresh rate, click the Refresh list and then click the refresh rate you want.
To change the range or timeframe, click the Range list and then click the range you want.
23.1.4.3 Dashboards
Section 3 provides access to five different dashboard types:
-
Location
For information about the Location dashboard, refer to Section 23.1.4.3.1, "Viewing Data Type by Location."
-
Scoring
For information about the Scoring dashboard, refer to Section 23.1.4.3.2, "Viewing a List of Scoring Breakdowns."
-
Security
For information about the Security dashboard, refer to Section 23.1.4.3.3, "Security Dashboard," and Section 23.1.4.3.4, "Viewing a List of Rules or Alerts by Security."
-
Device
For information about the Device dashboard, refer to Section 23.1.4.3.5, "Viewing Browser and Operating System Data by Device."
-
Performance
For information about the Performance dashboard, refer to Section 23.1.4.3.6, "Viewing a Data Type by Performance."
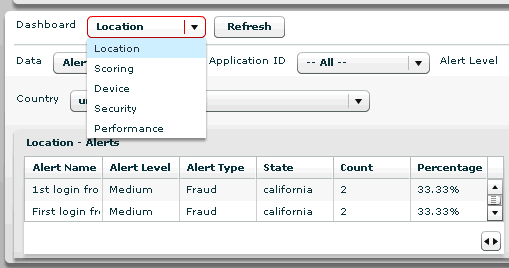
For each dashboard type you can select the type of data you want to see from a menu of data types. For example, if you select the Location dashboard, a Country list appears that enables you to select the country you want.
Figure 23-4 Choices After Data Type Selection
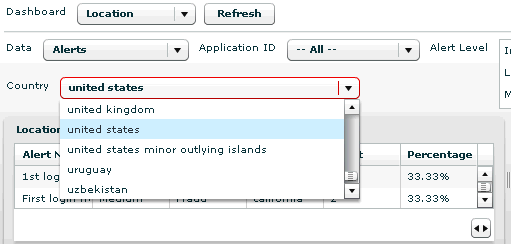
Description of "Figure 23-4 Choices After Data Type Selection"
23.1.4.3.1 Viewing Data Type by Location
You can view data type by location.
-
In Section 3, in the Dashboard dropdown menu, select Location.
The section becomes a Location dashboard.
-
In the Data dropdown menu, select the data type you want to view by location.
The data types you can select to view by country are the following:
Table 23-4 Data Types by Location
Data Types by Location Definition Alerts
Alert that have been triggered by country
Actions
Actions that have been taken by country
KBA Challenges
KBA challenges that have been triggered by challenge result and country
OTP Challenges
OTP challenges that have been triggered by challenge result and country
Routing Type
Routing types by country
Sessions
Sessions by country
Temporary Allow
Temporary allows that have been made by country
-
To narrow the list to a specific Organization ID, select an application from the Organization ID dropdown menu
-
To narrow the list to a specific timeframe, select a ranges from the Range dropdown menu.
-
To narrow the list to a specific checkpoint, select a checkpoint from the Checkpoint dropdown menu.
-
To narrow the list to a specific country, select a country from the Country list, click the country you want.
-
If you selected the alerts data type, you can narrow the list further by selecting the alert level you want from the Alert Level box.
-
If you selected the alerts or temporary allow data type, you can narrow the list further by selecting the checkpoint you want from the Checkpoint list.
Note:
For KBA challenges from phone challenges, the country will be listed as "Data Not Available". For these records, the trending graph will not be displayed.23.1.4.3.2 Viewing a List of Scoring Breakdowns
To view a list of scoring breakdowns:
-
In the Dashboard list, click Scoring.
The Scoring dashboard appears and defaults to risk score.
-
To narrow the list to a specific checkpoint, in the Checkpoint list, click the Checkpoint you want.
-
To narrow the list to a specific timeframe, in the Ranges list, click the range you want.
-
Click Refresh.
23.1.4.3.3 Security Dashboard
Items in the Dashboard list are accessible based on your role. Only fraud investigators can access the Security dashboard.
23.1.4.3.4 Viewing a List of Rules or Alerts by Security
To view a list of rules or alerts by security:
-
In the Dashboard list, click Security.
The Security dashboard appears and defaults to rules.
-
To specify a different data type, on the Data list, click the data type you want.
The data types provided.
-
Rules
-
Alerts
-
-
To narrow the list to a specific Organization ID, on the Organization ID list, click the Organization ID you want.
-
To narrow the list to a specific checkpoint, in the Checkpoint list, click the range you want.
-
To narrow the list to a specific timeframe, in the Ranges list, click the range you want.
-
Click Refresh.
23.1.4.3.5 Viewing Browser and Operating System Data by Device
To view browser and operating system data by device:
-
In the Dashboard list, click Device.
The Device dashboard appears and defaults to browser/operating system.
-
To narrow the list to a specific Organization ID, in the Organization ID list, click the Organization ID you want.
-
To narrow the list to a specific timeframe, in the Ranges list, click the range you want.
-
Click Refresh.
23.1.4.3.6 Viewing a Data Type by Performance
To view a data type by performance:
-
In the Dashboard list, click Performance.
The Performance dashboard appears and defaults to rules.
-
To specify a different data type, in the Data list, click the data type you want.
The data types provided are:
Table 23-5 Data Type by Performance
Data Type by Performance Definition Rules
Rules currently in the system
Policies
Policies currently in the system
Checkpoints
Points in a session when rule is run
APIs
Calls into the system through the soap interface
Tracker APIs
Calls into the tracker subsystem
Authorization APIs
Calls into the authorization subsystem
Common APIs
Miscellaneous calls
CC APIs
Calls into the Cases subsystem
Rules APIs
Calls to the rules processor
Figure 23-5 Viewing Data Type by Performance

Description of "Figure 23-5 Viewing Data Type by Performance"
-
If you selected the rules or policies data type, you can narrow the list further by selecting the checkpoint you want from the Checkpoint list.
-
To view data trended over a specific timeframe, in the Ranges list, click the range you want.
-
To trend data for a specific data type item, select the row from the Performance table.
-
Click Refresh.
23.1.4.3.7 Using the Total and Trending Views
The left side of the dashboard panel displays a total view and the right side displays a trending view of the selected data type.
The total and trending view sections are placed side by side, and you can toggle between the views to look at the details of one more clearly. For example, you can expand the trending view section to see the entire legend instead of a portion of it.
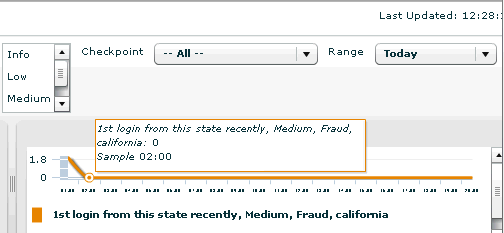
You must select a row from the table in the total view to see data in the trending view. After selecting a row or more, the trending view will show you the corresponding graph(s) of the data. Graphs are shown in different colors to distinguish the data schemes that are represented. The colors are generated on the fly; they are not predefined.
23.1.4.3.8 Viewing the Trending View Graph
The graph in the trending view adjusts accordingly based on the information being shown. The Y-coordinate will adjust depending on the highest data point. The sample will adjust based on the range. Also, whether you can choose to see data by hours, days, weeks, or months will depend on what is selected for the range.
23.1.4.3.9 View by Range
To narrow the data gathered to a specific time frame, from the Range list, select Today, Last 1 day, Last 7 days, Last 30 days, or Last 90 days.
23.1.4.3.10 View by Sample
To view data by a periodic interval, from the Samples list, select hourly, daily, weekly, or monthly. The choices available will depend on the range selected.
An example would be that if you have collected data over a period of six months, and you want to show how much data was collected every day using last month's data, you would choose to show daily samples trended over a month.
23.1.4.3.11 Last Updated
The "Last Updated" field, which also appears in the performance panel (Section 1), is updated when you select a different data type.
23.2 Monitoring Performance Using the Dynamic Monitoring System
Oracle Adaptive Access Manager uses the Oracle Dynamic Monitoring Systems (DMS) to measure application-specific performance information for logins and rule and API execution. DMS is notified when events occur, when important intervals begin and end, or when pre-computed values change their state. At run time, DMS stores metrics in memory and enables you to save or view the metrics in Fusion Middleware Control. DMS can display statistics of your system using the Oracle DMS Spy application to aid in troubleshooting and diagnostics.
The Oracle DMS Spy application is launched by entering http://machine_name:port/dms/ into your browser URL address field. The following metric tables are available:
The following metric tables are available:
23.2.1 Login Information (Counts Only)
Login Information (Counts only) that is sent are listed in Table 23-6.
| Description | DMS Noun Path | DMS Noun Type/Group |
|---|---|---|
|
Login Count - Total |
/OAMS/OAAM/LoginCount_Total |
OAMS.OAAM_Counters |
|
Login Count - Success |
/OAMS/OAAM/LoginCount_Success |
OAMS.OAAM_Counters |
|
Login Count - Failed |
/OAMS/OAAM/LoginCount_Failed |
OAMS.OAAM_Counters |
|
Login Count - Blocked |
/OAMS/OAAM/LoginCount_Blocked |
OAMS.OAAM_Counters |
|
Login Count - Challenged |
/OAMS/OAAM/LoginCount_Challenged |
OAMS.OAAM_Counters |
23.2.2 Rules Engine Execution Information (Count and Time Taken to Execute)
The rules engine execution information (count and time taken to execute) is shown in Table 23-7.
23.2.3 APIs Execution Information (Count and Time Taken to Execute)
The APIs execution information (count and time taken to execute) is shown in Table 23-8
23.3 Monitoring Performance Data and Administrative Functions Using Fusion Middleware Control
Fusion Middleware Control organizes a wide variety of performance data and administrative functions into distinct, Web-based home pages. The Fusion Middleware Control home pages make it easy to locate the most important monitoring data functions from a Web browser.
23.3.1 Displaying the Fusion Middleware Control
To display Fusion Middleware Control:
-
Enter the Fusion Middleware Control URL, which includes the name of the host and the administration port number assigned during the installation. The following shows the format of the URL:
http://hostname.domain:port/em
-
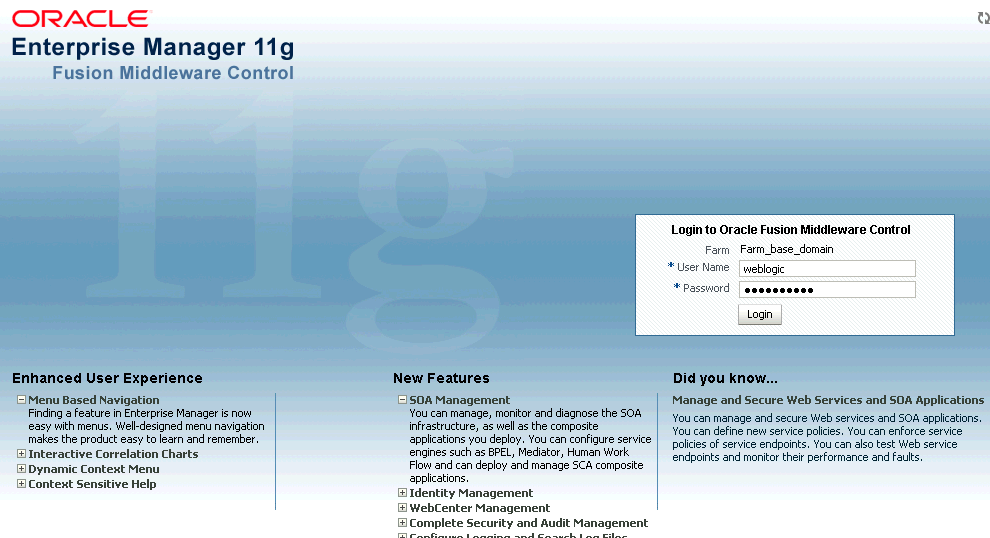
Enter the Oracle Fusion Middleware administrator user name and password and click Login.
The default user name for the administrator user is
weblogic. This is the account you can use to log in to Fusion Middleware Control for the first time. The password is the one you supplied during the installation of Oracle Fusion Middleware.
The Fusion Middleware Control Login is shown in Figure 23-8.
Figure 23-8 Fusion Middleware Control Login
Description of "Figure 23-8 Fusion Middleware Control Login"
23.3.2 Displaying Base Domain 11g Farm Page
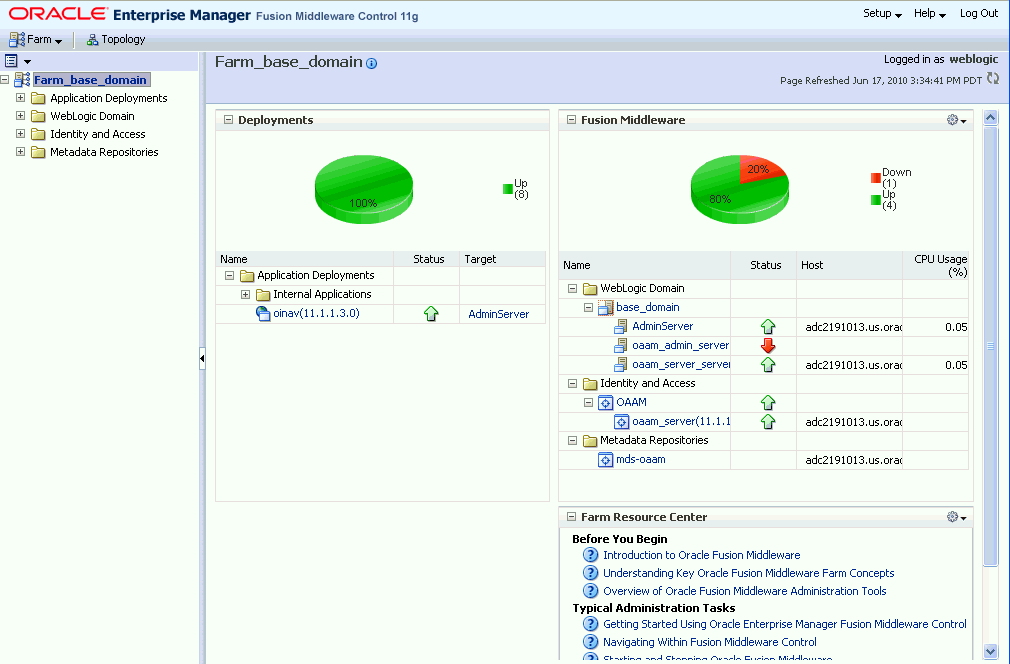
When you first log in to Fusion Middleware Control, the Base Domain home page is displayed.
Fusion Middleware Control displays the target navigation panel on the left and the content panel on the right.
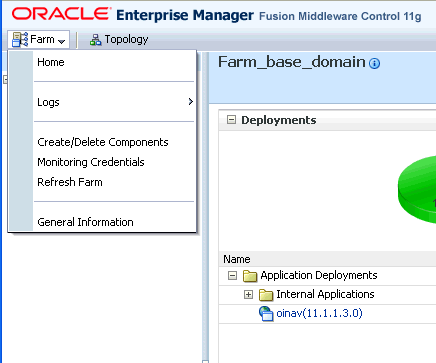
The farm home page is shown in Figure 23-9
Figure 23-9 Oracle Adaptive Access Manager Farm Home Page
Description of "Figure 23-9 Oracle Adaptive Access Manager Farm Home Page"
The content panel displays the overall status of the Oracle Fusion Middleware environment and links to reference information.
From here, you can view
-
The status and target of the internal applications in the deployment.
-
The status, host, and CPU usage of the repository and server instances.
-
Resource information on concepts and tasks
The target navigation panel lists all of the targets in the farm in a navigation tree.
Oracle Adaptive Access Manager details in Fusion Middleware Control are divided into the following nodes within the navigation panel:
-
Application Deployments
-
WebLogic Domain
-
Identity and Access
-
Metadata Repositories
When you select a target, such as a Managed Server or a component, the target's home page is displayed in the content panel and that target's menu is displayed at the top of the page, in the context panel. For example, if you select a Managed Server, the WebLogic Server menu is displayed. You can also view the menu for a target by right-clicking the target in the navigation panel.
Farm Menu in the upper left corner of the target navigation panel provides a list of operations that you can perform on the farm.
Dynamic Target Menu provides a list of operations that you can perform on the currently selected target. The menu that is displayed depends on the target you select. The menu for a specific target contains the same operations as those in the Right-Click Target Menu.
23.3.3 Oracle Adaptive Access Manager Cluster Home Page
To access the Oracle Adaptive Access Manager Cluster Home page:
-
Log in to Fusion Middleware Control.
-
Expand the Identity and Access node.
-
Click the OAAM (cluster) node.
The Oracle Adaptive Access Manager Cluster Home page appears. Use this page to monitor the OAAM cluster.
In the Oracle Access Management Access Manager Cluster Home page, you can:
-
Monitor the OAAM cluster
-
View the status of the OAAM servers that are part of the OAAM cluster
-
View details of the database used by Oracle Adaptive Access Manager
-
Access general information about the OAAM cluster such as the name, version, Oracle Home, and domain home
-
Access the performance summary of the server instances in the cluster
Monitor the Oracle Adaptive Access Manager cluster
The Performance Overview section of the Oracle Adaptive Access Manager Cluster Home page shows a graphical representation and a table view of the login statistics.
The data shown are for:
-
Number of successful logins during the last 5 minute collection interval
-
Number of logins failed during the last 5 minute collection interval
In the graphical representation, the x axis shows the time and the y axis shows the number of logins.
The performance overview is also available in tabular format when you click the Table View link at the bottom of the graph.
View the status of the servers that are part of the Oracle Adaptive Access Manager cluster
The Deployment section of the Oracle Adaptive Access Manager Cluster Home page provides information on the statuses of the OAAM server instances.
You can view the following information:
| Fields | Description |
|---|---|
| Instance Name | The name of the OAAM server instance. For example: oaam_server. |
| Status | The status of the OAAM server instance:
|
| Host | The name of the machine where the server is running. |
| Port | The address on that machine where the server is listening. |
| Server Name | The name of the container in which the applications are running |
| Total Logins | The total number of logins attempted since startup. |
| Logins Successful | The total number of successful logins since startup |
| Logins Failed | The total number of failed logins since startup. |
View details of the data repositories used by Oracle Adaptive Access Manager
To view hostname, port, and Service ID of the data repository, refer to the Data Store section. Oracle Adaptive Access Manager uses the RDBMS database as its data store.
| Fields | Description |
|---|---|
| Hostname | The name of the server where the data store is located. |
| Port | The port on which the Listener is listening for Oracle connections |
| Service ID | The name of the database that Oracle Adaptive Access Manager is using |
Access general information about the Oracle Adaptive Access Manager
In the Oracle Adaptive Access Manager Cluster Home page, you can access general information about the cluster and the datasource.
To view the target name, version, Oracle Home, and Domain home:
-
Click Oracle Adaptive Access Manager Cluster at the top of the home page to expand the dynamic menu.
-
Select General Information.
Access the Performance Summary for the Oracle Adaptive Access Manager Cluster
To see a performance summary for insight into the current performance of the Oracle Adaptive Access Manager cluster:
-
Click Oracle Adaptive Access Manager Cluster at the top of the home page to expand the dynamic menu.
-
Click Performance Summary.
23.3.4 Oracle Adaptive Access Manager Server Home Page
The Oracle Adaptive Access Manager Server Home page displays a performance overview of the instance.
To access an Oracle Adaptive Access Manager Server Home page:
-
Log in to Fusion Middleware Control.
-
Expand the Identity and Access node.
-
Expand the OAAM (cluster) node.
-
Click an OAAM server node.
The Oracle Adaptive Access Manager Server Home page appears. From this page, you can:
-
View statistic summary for the OAAM server instance
-
View performance overview (graphical representation and table)
-
Access a List of Operations to perform
View statistic summary for the Oracle Adaptive Access Manager server instance
The OAAM Server Home Page displays a Performance Overview with key metrics.
From this page, you can view a statistic summary for the OAAM Server instance that was selected.
| Metric | Description |
|---|---|
| Logins - Logins Successful | Total number of successful logins since startup. |
| Logins - Logins Failed | Total number of login attempts that failed since startup. |
| Checkpoint - Average Processing Time | Average time (in ms) for all the policies in a checkpoint to process since startup. |
| Checkpoint - Number of Checkpoints Processed | Total number of checkpoints processed since startup. |
| Policies - Average Policy Processing Time | Average time (in ms) to process a policy |
| Policies - Number of Polices Processed | Total number of policies processed since startup |
View performance overview of the Oracle Adaptive Access Manager server instance
The Performance Overview section of the OAAM Server Home page provides a graphic representations of logins to the OAAM server instance. You can also open a table view of logins from this section.
-
Graphical
The x axis shows the time.
The y axis shows the number of logins, checkpoints, or policies processed.
-
Table
Click Table View to show the Performance Overview in tabular format.
Access the list of operations to perform on the Oracle Adaptive Access Manager server instance
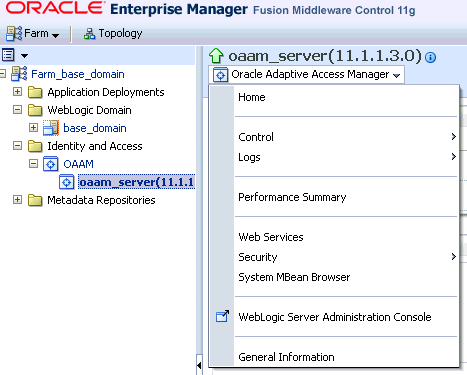
The Oracle Adaptive Access Manager menu, which is available when you click Oracle Adaptive Access Manager at the top of the page, provides a list of server instance-related operations. This menu contains the same operations as those in the context menu.
| Menu Item | Operation |
|---|---|
| Home | Enables you to view the instance home page |
| Control | Enables you to start up and shut down the server instance
From the menu, click Control and select Startup or Shutdown. |
| Logs | Enables you to view server logs and configure logging
From the menu, click Logs and select View Log Messages or Log Configurations. |
| Performance Summary | Enables you to view a performance summary
From the menu, click Performance Summary. The categories for the summary metrics are:
|
| Web Services | Enables you to view web services
From the menu, click Web Services. |
| Security | Enables you to view OAAM Server application policies and roles
From the menu, click Security and select Application Policies or Application Roles. |
| System MBean Browser | Enables you to access the System MBean Browser
From the menu, click System MBean Browser. |
| WebLogic Server Administration Console | Enables you to access the WebLogic Server Administration Console
From the menu, click WebLogic Server Administration Console. |
| General Information | Enables you to view general information about the server instance
From the menu, click General Information. |
23.4 Use Cases
This section provides a scenario of how Oracle Adaptive Access Manager's dashboards are used.
23.4.1 Use Case: Trend Rules Performance on Dashboard
Through using the dashboard, Security Administrators--who plan, configure and deploy policies--can monitor the performance of rules and modify if necessary.
Rules and policies can potentially have a performance impact. For example, if the Security Administrator defines a new policy to check for a user, who is not using an e-mail address that had been used before (ever). If the bank has more than 1 billion records in the database, performing that check against all the records for every transaction has great impact on performance.
To trend rule performance on the dashboard (find the average rule processing times for the past week with daily samples):
-
Log in to the OAAM Administration Console.
-
In the Navigation tree, select Dashboard. The dashboard is displayed.
The dashboard is divided into three sections:
-
The performance panel on the top presents real-time data. It shows the performance of the traffic that is entering the system. A trending graph is shown of the different types of data based on performance.
-
The summary panel in the middle presents aggregate data based on time range and different data types.
-
The dashboard at the bottom presents historical data. The detailed dashboards are used for trending data over time ranges.
-
-
In the performance dashboard in Section 3, select Performance from the Dashboard list.
-
Select Rules from the Data list.
You have selected Rules to view rule performance.
The rules appear in the Performance - Rules table.
-
Narrow the data to view by a specific time frame. To view average rule processing times for the past week, in the Range list, select Last 7 Days.
The average processing time for each rule is shown in the Average Processing Time column of the Performance-Rules table.
-
Select the sample to use to trend the data. To specify that you want to use daily samples to trend the performance data, select Daily from the Sample list.
-
View the specific trend graph. Click a specific rule in the Performance - Rules table to see the performance trend graph.
23.4.2 Use Case: View Current Activity
Business Analyst, Security Administrators, and Fraud Investigators are interested in actions that affect the user.
The Dashboard panel (Section 3) displays a total view and a trending view of the selected data type.
To monitor actions:
-
View the number of blocks
-
View the number of KBA challenges
-
View the number of OTP challenges
-
Trend the information over time, taking note of spikes and number of customers affected.
23.4.3 Use Case: View Aggregate Data
Business Analyst, Security Administrators, and Fraud Investigators are interested in actions that affect the user.
To obtain up-to-date numbers for user access and actions, view the Summary panel (Section 2), which provide an aggregate of the data.
23.4.4 Use Cases: Additional Security Administrator and Fraud Investigator Use Cases
Security Administrators and Fraud Investigators are interested in viewing:
-
Current activity and trended activity over time
-
Average performance numbers and trended performance averages over time
-
Distribution of events trended by geography
-
Security events trended over time
Viewing Current Activity and Trended Over Time
Security Administrators and Fraud Investigators are interested in viewing current activity and trended over a short period of time.
-
Log in to the OAAM Administration Console.
-
Open the Dashboard.
-
In the Performance Panel (Section 1) select a data type from the Data list.
-
View statistics in total view and trending view.
-
Total view - current activity over short period of time
-
Trending view - current activity trended over a short period of time
-
-
In the Summary Panel (Section 2), view a summary of the current activity for a range.
-
Sessions
-
Actions
-
Alerts
-
and others
-
Average Performance Numbers and Trended Performance Averages Over Time
Security Administrators and Fraud Investigators are interested in viewing average performance numbers and trended performance averages over time
-
Log in to the OAAM Administration Console.
-
Open the Dashboard.
-
In the Performance dashboard (in Section 3), view the following by performance.
-
Rules
-
APIs
-
and others
-
Distribution of Events Trended by Geography
Security Administrators and Fraud Investigators are interested in viewing a distribution of events trended by geography.
-
Log in to the OAAM Administration Console.
-
Open the Dashboard.
-
In the Performance dashboard (in Section 3), view events by location.
-
Sessions
-
Actions
-
Alerts
-
and others
-
Security Events Trended Over Time
Security Administrators and Fraud Investigators are interested in viewing security events trended over time.
-
Log in to the OAAM Administration Console.
-
Open the Dashboard.
-
In the Performance dashboard (in Section 3), view security events.
-
Rules
-
Alerts
-
and others
-
23.4.5 Use Cases Additional Business Analyst Use Cases
Business Analyst are interested in viewing:
-
Customer behavior trend
-
Operating system browser combinations
-
KBA challenges
-
Blocks
-
-
Distribution of events trended by geography
-
sessions
-
actions
-
alerts
-
and so on
-
23.4.6 Use Case: Viewing OTP Performance Data
-
In the Navigation tree, double-click Dashboard.
-
Check Section I of the Dashboard for OTP Challenges per minute.
The graph displays the OTP Challenges per minute statistics
-
Check Section II of the Dashboard
The summary table of the Dashboard displays the Count of OTP Challenges for the specified time period.
-
Check Section III of the Dashboard under Locations.
The Location Dashboard displays performance statistics, such as count, percentage, and others.


