For a Pivot Table metric, you can configure the aggregation method for the metric, the tooltip for summary values, and the format of the metric value.
Note that for predefined metrics, you cannot select the aggregation method.
For more information on the aggregation methods and how they work, see Aggregation methods and the data types that can use them.
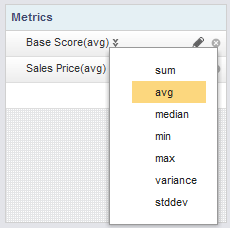
On the Table Layout tab of the Pivot Table edit view, each metric includes a drop-down list for you to select the aggregation method.
To configure all of the options for a metric:
-
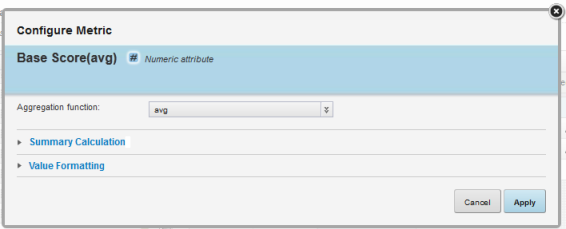
On the
Table Layout tab, click the edit icon for the
metric you want to edit.
The Configure Metric dialog is displayed.
-
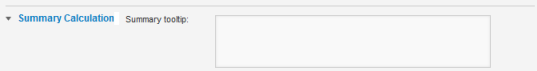
The
Summary Calculation section contains the
Summary tooltip field, used to add a
description to the tooltip displayed when users hover the mouse over a metric
value in a summary row or column.
When the dialog is first displayed, the section is collapsed. To expand or collapse the section, click the section heading.
-
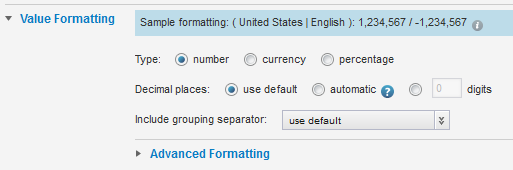
The
Value Formatting section contains settings to
customize the format of the metric values. When the dialog is first displayed,
the section is collapsed.
To expand or collapse the section, click the section heading.
For details on formatting displayed values, see Configuring the format of values displayed on a component.
