You can view data from multiple cash flow sheets in the log. This can be displayed in tabular or graphical format.
To view tabular data for multiple cash flow sheets
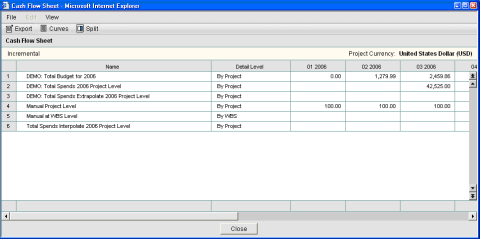
| 1 | From the Cash Flow (Basic) log toolbar, click the Table button. The table will display data from all cash flow sheets. This data is incremental. |
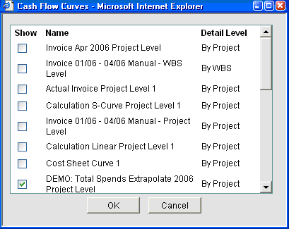
| 2 | To select specific cash flow sheets to display, click the Curves button. Select the curves in the Cash Flow Curves window and click OK. |
To view graphical data for multiple cash flow sheets
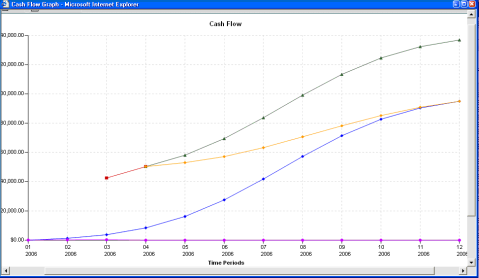
| 1 | From the Cash Flow (Basic) log toolbar, click the Graph button. The graph will display data from all cash flow sheets. This data is cumulative. |
| 2 | To select specific cash flow sheets to display, click the Curves button. Select the curves in the Cash Flow Curves window and click OK. |
Oracle Corporation
Primavera Unifier 9.10 • Copyright © 1998, 2012, Oracle and/or its affiliates. All rights reserved.