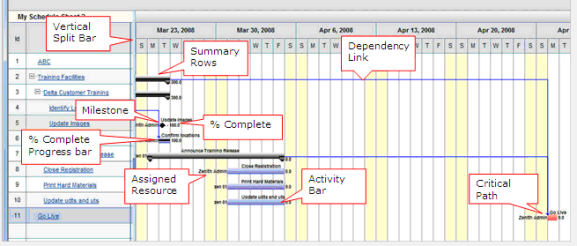
The Gantt Chart is displayed in the right pane of the schedule sheet. The activities are shown as bars and align with activities in the left pane. The activity bar is drawn with the start date, finish date, and duration elements of the activity. The Gantt chart is shown in week/day zoom mode by default.
The Gantt chart displays:
| • | Activity bars, which illustrate start and finish dates and duration |
| • | Dependency links between dependent activities |
| • | Summary rows |
| • | Milestones |
| • | Critical paths |
The Gantt chart is interactive. You can:
| • | Zoom in or out of the Gantt chart view to display detail or overview of scheduled activities. |
| • | Configure activity bar labels; for example, you can display percent complete to monitor the progress of activities, or names of resources assigned to activities, or virtually any activity property. See Gantt Chart tab on the Schedule Sheet Properties. |
| • | Increase and decrease activity schedule durations by dragging on bar ends. |
| • | Move activities from one time frame to another (modifying start and end dates). |
| • | Add or remove a predecessor (dependency). See Dependencies tab. |
| • | Resize Gantt window by dragging the vertical split bar. |
| • | Display critical paths. |
The Gantt chart is refreshed automatically when any changes are made on the activities.
Understanding the Gantt chart view
Oracle Corporation
Primavera Unifier 9.10 • Copyright © 1998, 2012, Oracle and/or its affiliates. All rights reserved.
 Zoom in or out of the Gantt chart