11 Hardware
This chapter describes hardware management features that are available in Oracle Enterprise Manager Ops Center:
11.1 Introduction to Managing Hardware Assets
Oracle Enterprise Manager Ops Center provides comprehensive lifecycle management for the hardware assets in your data center. The hardware assets can be handled individually or as a group. After the discovery and management of the hardware assets, as described in Asset Management, you can configure and then monitor them to gather the information to maintain them.
11.1.1 Configuring Hardware Assets
Use these deployment plans:
-
Install Server
-
Update BIOS Configuration
-
Configure Service Processor
-
Configure Server Hardware and Install OS
-
Configure RAID
-
Configure M-Series Hardware, Create and Install Domain
-
Configure and Install Dynamic System Domain
All the plans are based on hardware resource profiles. See Hardware Resource Profiles
11.1.2 Monitoring Hardware Assets
As soon as a hardware asset is managed, Oracle Enterprise Manager Ops Center starts to monitor it, according to the asset type's monitoring profile. The center pane displays information for a selected asset in a series of tabbed windows. The tabs and the type of information is specific for the asset type but, in general, Oracle Enterprise Manager Ops Center reports the following:
-
Health status
-
Power state
-
Power usage
-
Hardware variables and connectivity
You can change the monitoring thresholds in the standard profile to specify the conditions that generate an alert. You can also create custom profiles with different rule sets and alert parameters and apply the profile to a specific system, a group of homogeneous systems, or a group that you define.
For more information about monitoring policies and rules, see Chapter 4.
For information about monitoring power consumption, see Energy Tab.
11.1.3 Maintaining Hardware Assets
Based on your observations, you can control your hardware assets and do the following actions:
-
Update management credentials. See Chapter 2, "Asset Management"
-
Power systems on and off
-
Place in maintenance mode
-
Reset a server
-
Get access to the serial console
-
Use locator lights to identify a specific asset
-
Check firmware compliance and update firmware
Use these deployment plans or customize them:
-
Update Storage Appliances
-
Update BIOS Configuration
11.2 Roles for Hardware Management
Table 11-1 lists the tasks and the role required to complete the task. Contact your administrator if you do not have the necessary role or privilege to complete a task. See the Oracle Enterprise Manager Ops Center Administration Guide for information about the different roles and the permissions they grant.
Table 11-1 Hardware Roles and Permissions
| Task | Role |
|---|---|
|
Configure and Deploy Server |
Server Deploy Admin |
|
Install Server |
Server Deploy Admin |
|
Configure RAID |
Server Deploy Admin |
|
Update Management Credentials |
Security Admin |
|
Importing and uploading firmware images |
Storage Admin |
|
Edit Attributes |
Asset Admin |
|
Power On, Power Off, Power on with Net Boot |
Asset Admin |
|
Set Power Policy |
Asset Admin |
|
Reset Servers, Reset Service Processors, Refresh |
Asset Admin |
|
Locator Light On/Off, |
Asset Admin |
|
Snapshot BIOS Configuration, Update BIOS Configuration |
Asset Admin |
|
Update Firmware |
Update Admin |
|
Simulate a firmware update |
Update Admin Update Sim Admin |
|
Launch LOM Controller |
Asset Admin |
|
Edit Tags |
Asset Admin |
11.3 Actions for Hardware Management
After you manage your assets, you can perform the following actions:
-
Use a resource profile to configure a hardware asset
-
View utilization of systems
-
Modify energy consumption
-
Reset a server
-
Power systems on and off, including a forced power off
-
Place in maintenance mode
-
Get access to the serial console
-
Use locator lights to identify a specific asset
-
Check firmware compliance
-
Update firmware
-
Use a provisioning profile to update firmware
11.4 Location of Hardware Information in the User Interface
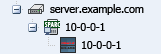
Hardware assets are visible in the All Assets section of the user interface. For assets with a service processor, both the service processor and the system are included, as shown in Figure 11-1.
Each type of hardware is also added to the appropriate group in the Resource Management view, as shown in Figure 11-2.
Figure 11-2 Example of Resource Management View
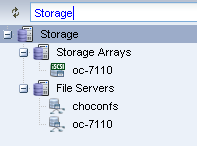
Description of "Figure 11-2 Example of Resource Management View"
Table 11-2 shows where to find information.
Table 11-2 Location of Hardware Information in the BUI
| To See | Location |
|---|---|
|
All servers |
Expand Servers in the Assets pane. The center pane lists up to 50 servers. |
|
Details for a specific server |
Expand Servers in the Assets pane. Then select one of the servers. The center pane includes a series of tabbed displays. |
|
Monitoring Rules for a specific server |
Expand Servers in the Assets pane. Then select one of the servers. Then select the Monitoring tab. |
|
Monitoring rules for a hardware type |
Expand Plans and then Operational Plans and then Monitoring Policies. Select a type. The center pane shows all of the rules and thresholds. |
|
Current firmware version |
Expand Servers in the Assets pane. Then select one of the servers. Then select either the Summary tab or the Hardware tab. Each one includes the Firmware table. |
|
A report of all attributes |
Expand Reports and then select System Information Report. |
11.5 Profiles for Hardware Management
The work flow of an asset deployment can be captured and enacted in a repeatable fashion using plans and the profiles included in the plans. Oracle Enterprise Manager Ops Center provides default profiles for configuring hardware asset types consistently. You can use the default profiles, make copies of the profile to edit, or create new ones.
Deployment proceeds from configuring the hardware, installing the correct firmware, provisioning the OS, and applying the required updates. The deployment is not only for servers with an OS installed but also for chassis, racks, power distribution units, and M-Series servers.
11.5.1 Hardware Resource Profiles
Use hardware resource profiles in a deployment plan to configure, install, or update systems. The Oracle Enterprise Manager Ops Center software provides the following hardware resource profiles:
You can use the default profiles, make copies of the profile to edit, or create new ones. Use the profiles in a deployment plan to configure your hardware assets.
11.5.2 Firmware Provisioning Profiles
Hardware depends on firmware to perform operations. Part of monitoring and managing a hardware asset is to make sure that it has the appropriate version of firmware. Oracle Enterprise Manager Ops Center uses firmware profiles to provision, or update, firmware on each type of asset.
A firmware profile is a set of actions and values that define how to provision one or more assets and specifies one or more firmware images. A firmware profile updates existing firmware assets completely and consistently. When you apply a deployment plan that contains a firmware profile, Oracle Enterprise Manager Ops Center compares the versions of each firmware image specified in the profile with the versions of the existing firmware on the asset and then takes the action you specify in the profile.
11.6 Configuring the Service Processor
The Declare Unconfigured Asset action includes the service processor in the Oracle Enterprise Manager Ops Center environment. You can configure only unconfigured service processors, that is, a processor in its factory default state. Use a deployment plan to configure the service processor:
-
Configure Service Processor
-
Update BIOS Configuration
-
Configure and Deploy Server
-
Install Server
An alternative to specifying the configuration in the profile, is to duplicate an existing configuration. You can create a snapshot of the BIOS of a working service processor, which creates also creates profile. You then apply the profile to an unconfigured service processor.
11.6.1 Creating a Service Processor Configuration Profile and Plan
-
Expand Plans in the Navigation pane and the select Profiles and Policies.
-
Expand Service Processors.
-
Click Create Profile. The first step of the wizard is displayed, as shown in Figure 11-3. Depending on the subtype and target you select, more steps are added.
Figure 11-3 Create Profile - Service Processor
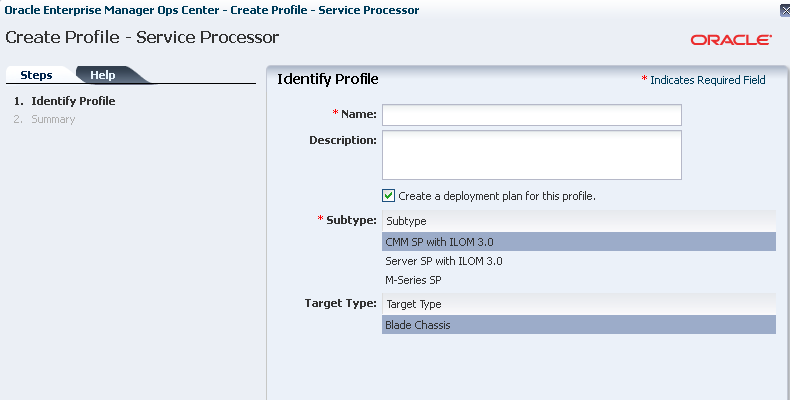
Description of "Figure 11-3 Create Profile - Service Processor"
-
Complete the specification of the service processor and click Finish.
The new profile and plan are available from the Assets pane.
11.6.2 Creating a BIOS Configuration Profile and Plan
-
Expand Plans in the Navigation pane and the select Plans.
-
Expand Update BIOS Configurations.
-
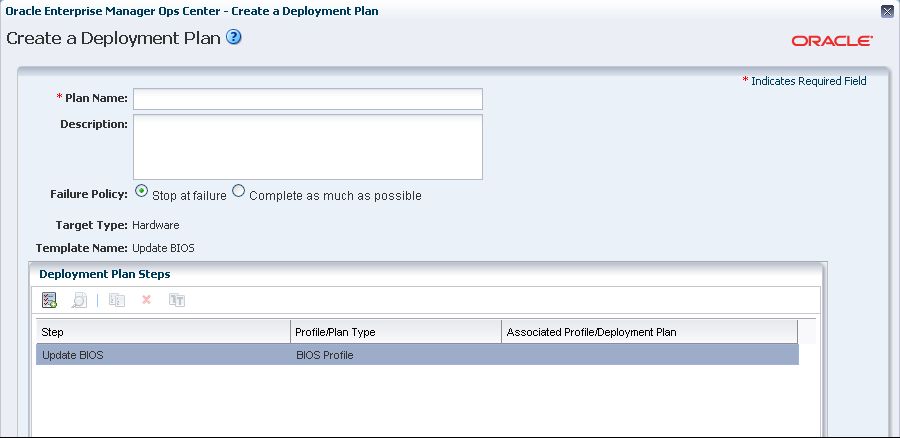
Click Create Plan from Template. Figure 11-4 shows the first step of the wizard, which includes the Update BIOS profile.
-
Click the Update BIOS profile.
-
Click the Create Profile icon. Figure 11-5 shows the window for creating the profile.
Figure 11-5 Create Profile-BIOS Configuration
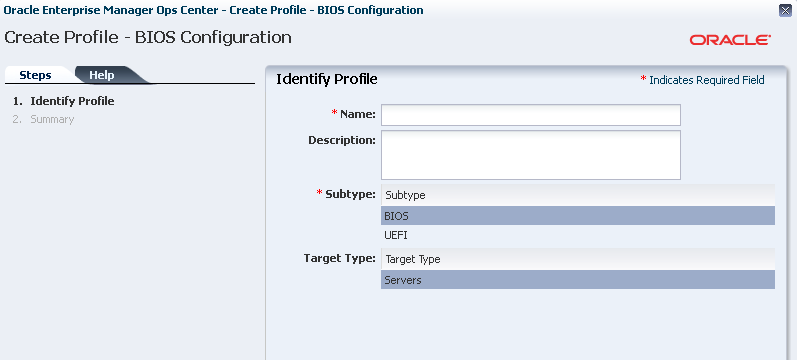
Description of "Figure 11-5 Create Profile-BIOS Configuration"
-
Enter a name and description and then select the type of BIOS and the type of target.
-
Click Next to review and then click Finish to submit the job.
-
When the job is completed, return to the Create a Deployment Plan window.
-
Specify a name for the plan and select the new profile.
-
Click Save to submit the job.
The new profile and plan are available from the Assets pane.
11.6.3 Creating a Snapshot of a Service Processor Configuration
-
Expand Assets in the Navigation pane and select Servers.
-
Select the configured server.
-
Click the Hardware tab in the center pane.
-
In the Component Navigation section, select Service Processor. The Service Processor Configuration section displays the configuration attributes and values.
-
In the Service Processor Snapshots section, click the Create Snapshot icon to display the window shown in Figure 11-6.
Figure 11-6 Create Service Processor Configuration Snapshot
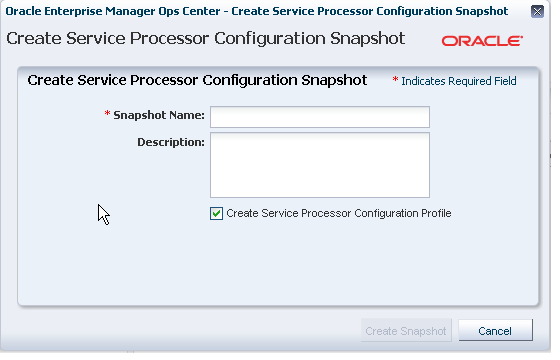
Description of "Figure 11-6 Create Service Processor Configuration Snapshot"
Note:
An alternative method of displaying this window if you are familiar with the current configuration is to select the server and then choose Snapshot BIOS Configuration in the Actions pane. -
Specify a name for this snapshot and accept the default of creating a profile from the snapshot.
-
Click Create Snapshot to submit the job.
-
When the job completes, the snapshot is located in the EC local library.
11.6.4 Applying a Snapshot of a Server Processor Configuration
This procedure applies a snapshot of one server's service processor to another, unconfigured service processor. Use the Update BIOS Configuration action or use the snapshot profile as a step in the Install Server deployment plan.
View a Service Processor Snapshot
To verify the snapshot configuration before you attempt to configure a new server, view the snapshot.
-
Expand Libraries in the Navigation pane and then select the current EC local library.
-
In the center pane, scroll down to the BIOS Configuration section of the library.
-
Select the snapshot and then select the View Snapshot icon.
-
You can apply the snapshot directly to a server or you can use a deployment plan.
Apply a Service Processor Snapshot to a Server
-
Expand Assets in the Navigation pane and then select Servers.
-
Select the unconfigured server.
-
Click Update Service Processor in the Action pane. A one-step wizard is displayed, including the list of snapshots in the EC local library that are appropriate for the selected server.
-
Select the snapshot from the list.
-
Click Next to review the Summary and then click Finish to submit the job.
When the service processor is configured, the server reboots.
Apply a Service Processor Snapshot Profile to a Server
-
Expand Plans in the Navigation pane and then select Profiles.
-
Expand Update BIOS Configuration and select the profile for the snapshot.
-
Review the profile in the center pane. To modify the profile, click the Edit Profile icon.
-
Create a plan that includes this profile as its only step or edit an existing deployment plan to include this profile.
11.7 Configuring a RAID Controller
Oracle Enterprise Manager Ops Center provides a default profile for configuring RAID controllers. You can configure and update the hardware devices that can be done only through the host OS. This profile provisions a reduced OS image along with the management pack on the target to configure RAID.
Caution:
When you reconfigure an existing RAID controller, all the data on the disk is lost.11.8 Configuring a Dynamic System Domain
You can create domains on a M-series server.
-
Verify that a user account with
platadmprivilege exists on the XSCF processor and is included in the profile. Disable the audit policy for this user account, using the following command:setaudit -a opsadm=disable
-
Verify that you can use
sshto log in to the XSCF processor.
To configure a Dynamic System Domain, you apply a deployment plan to an M-Series server, as described in Chapter 8. The plan includes the profile for the Dynamic System Domain.
11.9 Configuring a Rack and Placing Components
The rack asset is a group that includes the other managed assets installed in the physical rack, such as servers or compute nodes, storage arrays or appliances, switches, and power distribution units (PDU). After you create the rack, you put assets in the rack so that Oracle Enterprise Manager Ops Center can present them and manage them as if it were a physical asset.
-
Expand Assets in the Navigation pane and select Racks.
-
Click Create Rack in the Action pane.
-
Enter the name for the rack.
-
For a rack containing an Oracle Engineered System, specify the serial number of the rack.
-
Enter the total number of slots in the rack. A full rack has 42 slots. Default to 42.
-
You have the option to place assets into the rack immediately after this procedure ends or to perform this task at a later time.
-
Enter a description for this rack.
-
Add semantic tags that are appropriate for this rack.
-
Click Create Rack to submit the job.
Use the Place/Remove Assets in Rack action and the Place/Remove PDU in Rack action to specify each asset in the physical rack and its location in the rack so that Oracle Enterprise Manager Ops Center can represent the physical rack accurately to remote users.
The rack asset is a group that includes the managed assets installed in the physical rack, such as servers or compute nodes, storage arrays or appliances, switches, and power distribution units (PDU).
Use the Place/Remove Assets in Rack action and the Place/Remove PDU in Rack action to specify each asset in the physical rack and its location in the rack so that Oracle Enterprise Manager Ops Center can represent the physical rack accurately to users who cannot examine the rack. Update the type and location of the assets in the rack asset when the configuration of the physical rack changes.
Placing a Power Distribution Unit in a Rack
-
Expand Assets in the Navigation pane and select Racks from the Resource Management Views.
-
Select the rack.
-
Click Place/Remove Assets in Rack in the Actions pane or click the Details tab to navigate to the icon. The Place Assets in name Rack window opens, which displays a list of all managed assets in the physical rack. You can filter the list by type or attribute.
-
Click an asset and then enter its slot number.
-
Click Place Asset in Rack. The Assets in the Rack pane is updated to show the location.
-
Continue to select assets and place them in the rack.
-
To change an asset's slot, select it and click Edit Placement. Enter a new slot number.
-
To remove an asset, select it and click Remove Asset. The asset is deleted from the Assets in the Rack pane and is available to be placed.
-
When you are satisfied with the configuration displayed in the Assets in the Rack pane, click Submit.
To add PDUs to the rack asset, use the Place/Remove PDUs action in the same way. Select the rack and the action. The assets you have placed in the rack are shown in the Assets in Rack pane. Add each PDU.
11.10 Hardware Monitoring
The Oracle Hardware Management Agents use Simple Network Management Protocol (SNMP) to monitor your Oracle hardware and storage devices. The software uses the Intelligent Platform Management Interface (IPMI) protocol to accesses the Oracle ILOM service processors.
A monitoring policy is a set of rules applied to an asset. If a status changes or a threshold is crossed, an alert is created. Oracle Enterprise Manager Ops Center provides default policies for each asset type. You can create new policies or modify existing policies.
11.10.1 Hardware Status
If a hardware asset can report a value for a hardware variable, Oracle Enterprise Manager Ops Center reports its current state and compares it to the threshold value.
-
Good – The hardware asset is working properly.
-
Unknown – Oracle Enterprise Manager Ops Center is unable to retrieve information from the sensor. The hardware asset is connected but is not reporting information.
-
Unreachable – The hardware asset cannot be contacted. This state indicates a network problem.
-
Warning Failure – Oracle Enterprise Manager Ops Center has detected a potential or impending fault condition. Take action to prevent the problem.
-
Critical Failure – A fault condition has occurred. Take corrective action.
-
Nonrecoverable Failure – The hardware asset has failed. Recovery is not possible.
-
Faulted – The hardware asset reports a fault. Contact service personnel to repair.
11.10.2 Groups of Hardware Assets
Oracle Enterprise Manager Ops Center monitors hardware assets according to the monitoring profile for that type of asset. To see the default profile for monitoring a hardware type, see Hardware Monitoring.
To change a threshold value, see Editing Monitoring Rules in Chapter 4.
11.10.3 Connectivity Status
Connectivity is the network interface of the system. You can view information about a hardware asset's Network Interface Card (NIC).
11.10.4 Service Processor Details
Use the Hardware tab to view information about each component of the system:
-
Name and SNMP Community
-
Whether Auto DNS through DHCP is in use, and any DNS Servers
-
Search Path, if any
-
Time Zone
-
Whether an NTP server is in use an its identifier
11.10.5 RAID Controller Details
-
RAID volume name
-
RAID level
-
Number of disks
-
Stripe zone
-
RAID Controller ID
11.10.6 Oracle ZFS Storage Appliance Details
The Oracle ZFS Storage Appliance support both file storage and application use.
The Dashboard tab reports the following hardware information:
-
Name
-
Description
-
Current Alert Status
-
Model
-
Serial Number
-
Management IP
-
Memory
-
Power
-
Locator Light
-
Appliance Kit Version
-
Running Time
-
Processor
The Hardware tab displays the appliance's firmware version and the following information for each component:
-
CPU: Name, Model, Architecture, Speed, Manufacturer
-
Memory: Name, Type, Size in bytes, Manufacturer, Part number, Serial number
-
Network Adapters: Name or each, MAC Address, Description, Manufacturer, Part number, Serial number
-
Disks: Name, Size in bytes, Manufacturer, Part number, Serial number
-
Power Supply: Name, Manufacturer, Part number, Serial Number
-
Fan Tray: Name, Manufacturer, Part number, Serial number
See Oracle ZFS Storage Appliance in Chapter 2 for discovery requirements.
11.10.7 ALOM and ILOM Servers Details
This version of the product software discovers and manages servers that use the ALOM or ILOM service processors. This is a description of the general details displayed for these servers.
For server hardware, the Summary tab displays:
-
Server Name
-
Description
-
Current Alert Status
-
Model
-
Serial Number
-
Management Interface IP
-
MAC Address
-
Processor
-
Memory
-
Power state
-
On – The server is powered on and running.
-
Standby – The server is powered off but responds to commands.
-
Unknown – An error occurred while attempting to retrieve the power status of the hardware. The server is connected but is not returning any information on power status.
-
Unreachable –The server cannot be contacted for information about its power state. This indicates a network problem or that the server is in standby mode.
-
-
Locator Lights state
-
A table with the available Tags
-
A table with the Firmware information
ALOM servers display summary information and a table with all the firmware installed.
ILOM servers include more information in the component navigation pane of the Hardware tab:
-
System: Description, type, and version of all firmware installed except for disk firmware. See the Disk tab for firmware version.
-
Processors or CPU: Architecture, number of Installed CPUs, Actual Power Consumption, Summary Description, number of Max CPUs, and Status. The Processors table displays for each CPU: Name, Model, Speed, Manufacturer, and Status.
-
Memory: number of Installed DIMMs, Installed Size in bytes, number of Max DIMMs, Status, and Actual Power Consumption. The Memory table displays for each DIMM: Name, Size in bytes, Manufacturer, Part number, Serial number, and Status is displayed on the Memory table.
-
Power or Power Supply: number of Installed Power Supplies, Actual Power Consumption in watts, Status, number of Max Power Supplies, and Max Permitted Power in watts. The Power Supplies table displays for each power supply: Name, Manufacturer, Part number, Serial number, and Status.
-
Cooling or Fan Tray: number of Installed Chassis Fans, number of Installed PSU Fans, Inlet Temperature, Status, number of Max Chassis Fans, number of Max PSU Fans, and Exhaust Temperature. The Fans table displays for each item: Name, RPM (%), and Status. Servers with older versions of ILOM list a Fan Tray group instead including the identifier of each available fan and its speed (RPM).
-
Storage or Disk: Installed Disk Size in bytes, number of Installed Disks, Status, Logical Volumes, and number of Max Disks. The Disks table displays for each item: Name, Presence Status, and Status.
-
Networking or Network Adapter: number of Installed Ethernet Nics, and Status. The Network Adapters table displays for each item: Name, MAC Address, Description, and Status.
-
PCI Devices: a table listing the PCI Devices. The table displays for each item: Name, Card Type, Description, Vendor ID, Device ID, and Part Number. This information is not available for servers with older versions of ILOM.
-
Service Processor: Name, Auto DNS Via DHCP, Search Path, Use NTP Server, NTP Server 2, SNMP Community, DNS Servers, Time Zone, and NTP Server 1. The Service Processor Snapshots displays for each item: Name, Creation Date, Description, and Created By.
11.10.8 M-Series Servers Details
The hardware resources in a SPARC Enterprise M-Series Server are divided into one or more logical units, called dynamic system domains. Oracle Enterprise Manager Ops Center can monitor each domain, in addition to the server hardware.
For an M-Series server, the Dashboard tab displays:
-
Number of dynamic system Domains it is supporting
-
Model
-
Serial Number
-
Description
-
Support contract
-
XCP Firmware Version
-
OBP Firmware Version
-
XSCF Firmware Version
-
Hypervisor Firmware Version
-
Operator Panel Switch Status: Locked
-
Current Alert Status
The Summary tab adds details to the information in the Dashboard tab. For the Power status, the reported status is for the server's domains. When any domain is powered on, the status is reported as powered on. When all domains are powered off, the Summary tab shows a status of Powered Off; the M-Series server itself remains powered on.
You can find the following information on the Summary tab:
-
Name
-
Model
-
Serial Number
-
Management IP
-
MAC Address
-
Current Alert Status
-
Power
-
Locator Light
-
Notification
-
All firmware versions including Description, Type and Version.
-
The table Domain displays for each item: Name, Model, Health, Power, Locator Light, Notification
The Hardware tab shows the state of the server or, if a Dynamic System Domain is selected, the state of that domain. At the System level, the Hardware tab includes the following information:
-
Model
-
Serial Number
-
State
-
Power
-
Locator Light
-
Notification
-
Operator Panel Switch State
For the M-5000 server, the System level of the Hardware tab also includes:
-
The Unallocated Resources table lists all the physical system boards and their status: PSD ID, Assignment Status, Power Status, Connection Status, Diagnostics Status, and Operational Status
-
The Allocated Resources table lists all domains that are using the physical system boards and their status: Domain ID, PSB ID, XSB ID, LSB ID, Assignment Status, Power Status, Connection Status, Diagnostics Status, and Operational Status
-
The Dynamic System Domain table lists all the domains and their details: Domain ID, MAC Address, Autoboot Policy, Secure Mode Policy, CPU Mode, Diagnostics Level, Domain Degradation Policy, and Operational Status
For Oracle SPARC M5-32 and M6-32 servers, the System level of the Hardware tab also includes:
-
System Type
-
Part Number
-
System Identifier
-
Management IP
-
Management MAC Address
-
Actual Power Consumption
-
Status
-
Data Source
-
The Subsystem Status table displaying a summary including: name of Subsystem, Status, and Inventory.
-
The Configured Dynamic System Domains table listing all the domains and their details: Domain ID, Domain Name, Priv MAC address, Auto Boot Policy, ILOM IP, Keyswitch State, and Operational Status
-
The Unconfigured Dynamic System Domains table listing the same information as the table above except for Domain Name.
-
Allocated Resources. No data is displayed on this table.
-
Unallocated Resources. No data is displayed on this table.
-
The Firmware table displaying for each item: Description, Type, and Version.
Oracle SPARC M5-32 and M6-32 servers include an ILOM 3.2 service processor. For more information about ILOM servers see ALOM and ILOM Servers Details.
Note:
M5 and M6 servers are supported, but some features have additional limitations. For more information see theTarget Servers section of the Certified Systems Matrix document in the Oracle Enterprise Manager Ops Center document library.Component Navigation Pane of Hardware Tab
Use the component navigation pane in the Hardware tab to view information about each component of the system:
-
CPU: Name, Architecture, Type, Manufacturer, Speed, Core Count, Thread Count, Serial Number, Part Number, Version, Status For Sensors: Name, Description, Type, and Value.
-
Memory: Name, Type, Size in bytes, Serial number, Part number, Status For Sensors: Name, Description, Type, and Value.
-
Board: Name, Serial number, Part number, Memory mirrored, Version, and Status.
-
Power Supply: Name, Serial number, Part Number, Status For Sensors: Name, Description, Type, and Value.
-
Board: Name, XSB Mode, Memory Mirrored, Serial Number, Part Number, Version, Status For Sensors: Name, Description, Type, and Value.
-
IO Unit: Name, Serial Number, Part Number Version, Status For Sensors: Name, Description, Type, and Value.
-
XSCF: Name, Host Name, Serial Number, Part Number, Version, and Status.
-
Fan Tray: Name, Manufacturer, Part number, and Serial number.
-
Fans: Name, Speed For Sensors: Name, Description, Type, and Value.
Oracle Enterprise Manager Ops Center monitors the voltage for the Board and IO Unit components and the speed for the Fan components. The Monitoring tab shows the actual value and the threshold values.
See Discovering a SPARC Enterprise M-Series Server in Chapter 2 for discovery requirements.
See ALOM and ILOM Servers Details for more information about the specific data available in the component navigation pane for Oracle SPARC M5-32 and M6-32 servers.
11.10.9 Switch Details
Oracle Enterprise Manager Ops Center can manage Sun Ethernet 10GbE Fabric switches and Sun Datacenter InfiniBand switches. These switches reside in the system or blade system and provide the switch fabric. Cisco Catalyst switches are also supported.
For more information about Oracle Datacenter and Ethernet switches, see: >>http://www.oracle.com/technetwork/documentation/oracle-net-sec-hw-190016.html#legacysecapp.
Oracle Enterprise Manager Ops Center reports hardware information on the Summary tab:
-
Name
-
Model
-
Port count
-
Serial number
-
Management Interface IP
-
MAC Address
-
Fabric Manager: true or false
-
Fabric Manager Address
-
Power state
-
Locator lights state
-
Notification state
-
Current Alert Status
-
Firmware types and versions
At the System level, the Hardware tab includes:
-
Model
-
Server Name
-
Serial Number
-
State
-
Power
-
Firmware versions
-
Sensors: temperature and voltage
You change the display to show information about each component of the switch:
-
Network Adaptors: Name or each, MAC Address, IP Address, Description
-
Power Supply: Name, Manufacturer, Part number, Serial Number For Sensors: Description, Type, Status
-
Fan Sensors: Description, Type, Value, Status, Warning Threshold (Lower), Warning Threshold (Upper), Critical Threshold (Lower), Critical Threshold (Upper), Non-Recoverable Threshold (Lower), Non-Recoverable Threshold (Upper)
The Actions pane displays the set of available actions to manage a switch. It includes the Launch Switch UI for accessing and managing the switch directly from its Web UI. For the Cisco Catalyst switch, the Launch Switch UI action will be disabled if the HTTP server is not enabled in the switch.
11.10.10 Rack Details
The rack's Dashboard displays the following information:
-
Name
-
Rack ID
-
Description
-
Number of Slots
-
Tags
-
Support
The Details tab shows the configuration of each slot in the rack. For each component in the rack, this tab displays the position, name, description, type, model and health status. The Power Distribution Units are included and their current status is displayed.
The Firmware tab displays the name, description, and version of the firmware for each component and the slot for each component:
-
Compute Nodes
-
Switches
-
Storage Appliances
-
Power Distribution Units
The rack's Charts tab displays the following plots, as described in Charts Tab:
-
Aggregate Power Usage
-
Power Usage
-
Average Fan Speed
The rack's Energy tab displays the information described in Energy Tab.
11.10.11 PDU Details
The Dashboard tab shows:
-
Name and Description
-
Model and serial number
-
Management IP address and MAC address, if any
The Details tab reports the same information and adds whether SNMP and HTTP is enabled and the version of the firmware.
11.10.12 Oracle Solaris Cluster Details
The Dashboard tab shows:
-
Name, description, and ID
-
Number of possible quorum votes and the current quorum votes
The Network tab shows the public and private interconnects used by the cluster.
The Quorum tab shows the status of each member of the quorum and the number of quorum votes for each member.
11.11 Monitoring Power Utilization
Input power is the power pulled into a power supply from an external resource. The power consumption of a hardware asset is the sum of the input power consumed by each power supply of the asset. Output power is the amount of power provided from the power supply to the system components, measured at the power supply output. Input power is calculated from output power by applying an efficiency function to the output power from each power supply.
Calculating power compensation for the blades is difficult because the power supplies are shared. Each blade gives a report based on the power consumption of the local components, but this is not an accurate power consumption value for an individual blade.
To measure the input power, the interfaces must be exposed and the service processors must be able to retrieve and report data with one-minute accuracy. Servers that can report power usage have a Charts tab.
You can see current power usage and change the display of power graphs using the controls on the Energy tab and the Charts tab.
11.11.1 Energy Tab
The asset's Energy tab reports power consumption as the current value and for a period of time, as well as attributes of the fan and power supplies.
The following general information is displayed in the energy tab:
-
Power consumption in watts.
-
System load for an OS.
-
Power policy.
-
Utilization percentage for an Oracle VM Server for SPARC.
-
Inlet and outlet temperature reporting the incoming and outcoming air temperature.
-
Cost per kilowatt-hour in the selected currency.
-
The currency units used to compute cost. The price per currency unit is set by the Edit Energy Cost action in the Administration section of the Navigation pane. See the Oracle Enterprise Manager Ops Center Administration Guide for information.
-
The total power cost in the selected currency. The period of time used to compute the cost is determined by the value selected in the Display list.
The data over time is represented in the following charts:
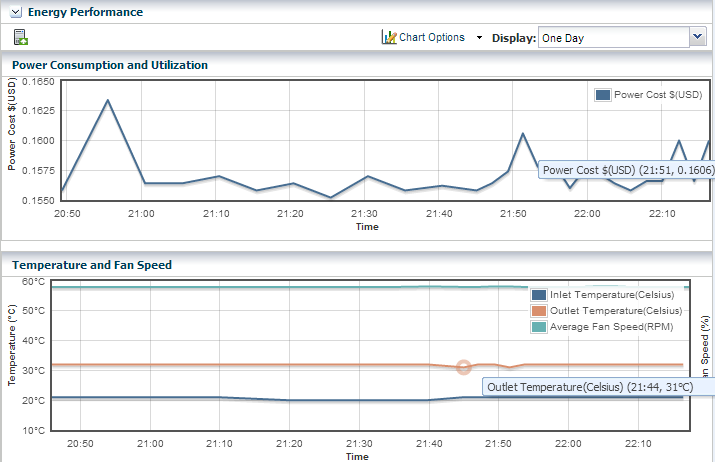
Description of the illustration energy_graphs.png
-
Power Consumption and Utilization. By default, the chart shows the power consumed in the last day in watts. If the server is shut down, the chart shows any existing historical data.
-
Temperature and Fan Speed. By default, the chart shows the incoming air temperature and the outgoing air temperature in Celsius, and the average fan speed in RPM. Click any point in the chart to see the data for that point in time.
Note:
Servers that use the ALOM and ILOM data model report fan speed in RPMs. Servers with SDM enabled ILOM –such as the M5-32 and M6-32 servers– report fan speed as a percentage of the maximum speed of the fan.
You can set the units for the power consumption and utilization chart's power axis using the Chart Options list. You can select watts or cost.
You can use the Display list to set the period of time that the charts display to one of the following values:
Table 11-3 Values of the Display List of the Energy Performance Charts
| Value | Charts' Points Sample Rate |
|---|---|
|
Live |
Five minutes |
|
One hour |
Five minutes |
|
One day |
Five minutes |
|
Five days |
Five minutes |
|
Three weeks |
One hour |
|
Six weeks |
12 hours |
|
Six months |
One day |
To make a graph with the minimum of two points, a hardware asset must have been managed for at least 10 minutes to view a one-hour graph and for at least two days to view the six-months graph.
The data for these time periods is stored separately. For example, if a server has been managed for two hours and you select the six weeks view, the graph cannot be displayed because only one point of data of that type has been stored; the second point has not yet occurred. If you then select the one day view, the graph can display 24 points of data (120 minutes at 5-minute intervals). However, the graph displays these points over a 24-hour period and not over the actual two-hour period. For the most accurate representation of the data, choose a time period that is less than or equal to the time that the hardware asset has been managed.
You can export the data for either the current view or all available data to a file in either CSV or XML format. Use the Export Chart Data toolbar icon to choose options for exporting the data.
If the graph is blank, one of the following conditions has occurred:
-
The server does not have the appropriate ILOM version.
-
The server has not been discovered through the ILOM driver.
-
The server is unreachable.
Power Supply and Fan Information Tables
The Power Supply table lists: the power supply number, manufacturer, and part and serial numbers.
The Fan Information table lists: the fan number, and fan speed as a percentage or in RPM.
11.11.2 Charts Tab
The Chart tab provides more ways to display the power utilization data. You can change the graphed data to a bar chart or an area chart. You can also export the data for either the current view or all available data to a file in either CSV or XML format. Use the Export Chart Data button to choose options for exporting the data.
For groups and virtual pools, the following options are available:
-
Select Order: The five highest or five lowest historical power utilization.
-
Select Resource: Select the Power or Aggregate Power option for a homogeneous or heterogeneous group of servers.
-
The Power option displays power utilization for the five highest or lowest power consumers in the group or virtual pool.
-
The Aggregate Power option displays the power utilization, using the sum of all members that report power consumption. The number of systems in the aggregate is included. For heterogeneous group, the Chart tab includes a table of all systems in the group and their various power attributes for the selected time period. From this table, you can power off and power on selected servers to conserve power.
-
11.12 Maintaining Hardware Assets
-
Update management credentials, see Updating Management Credentials in Chapter 2
-
Set power policy
-
Power systems on and off
-
Place in maintenance mode
-
Reset a server
-
Get access to the serial console
-
Enable and disable ports
-
Use locator lights to identify a specific asset
-
Check firmware compliance and update firmware. See Firmware Provisioning
11.12.1 Setting and Changing the Power Policy
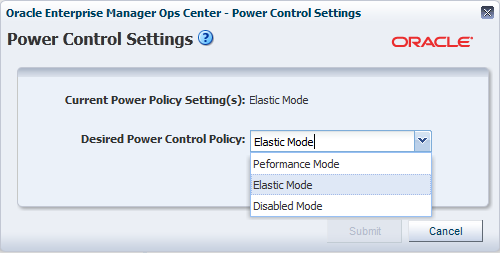
The power policy allows you to set an asset in one of three different modes:
-
Performance: Unused components are put into a slower speed or sleep state and power savings features with insignificant performance impact are enabled.
-
Elastic: Components are brought in to or out of a slower speed or a sleep state to match the system's utilization of those components.
-
Disabled: All components run at full speed or capacity. This option is available for some models and ILOM version.
-
Expand the Assets in the Navigation pane.
-
Select a hardware asset.
-
Click the Energy tab in the center pane.
Changing an Asset's Power Policy
-
Expand the Assets in the Navigation pane.
-
Select a hardware asset.
-
Click Set Power Policy in the center pane to display the window shown in Figure 11-7.
-
The current power policy is displayed. Choose the alternative policy.
-
Click Submit to create a job that sets the power policy.
11.12.2 Replacing a Failed Power Distribution Unit in a Rack
-
Expand Assets in the Navigation pane and then expand Racks.
-
Navigate to the rack type and expand to show its components. Expand Power Distribution Units.
-
Select the failed power distribution unit.
-
Click Place in Maintenance Mode in the Action pane.
-
Go to the rack's location and remove the failed PDU.
-
Install the new PDU and connect it to the network, according to the procedures in the Power Distribution Units User's Guide at http://docs.oracle.com/cd/E19844-01/index.html.
-
Verify that the new PDU has the same IP address as the failed PDU.
-
Use the PDU's web interface to configure the administrator user account, according to the procedure in the Power Distribution Units User's Guide.
-
Return to the Oracle Enterprise Manager Ops Center user interface and navigate to the same rack and the new PDU. Select the PDU.
-
Click Remove From Maintenance Mode in the Action pane.
-
To update the credentials for the administrator user, click Update Management Credentials in the Action pane. The wizard opens.
-
At the Management Type step, select HTTP credentials and then select the Create a new set of credentials option. Click Next.
-
Enter new credentials for the administrator user.
-
Click Apply to update credentials.
-
To create new SNMP credentials, click Update Management Credentials in the Actions pane again.
-
Select SNMP credentials and Create a new set of credentials.
Specify a community string that is different than the previous community string.
-
Press Apply to update credentials.
11.12.3 Installing and Upgrading Oracle Solaris Cluster
You use cluster profiles in a deployment plan to perform the following operations:
-
Install Oracle Solaris Cluster software
-
Upgrade Oracle Solaris Cluster software
See Appendix A for instructions on obtaining the current profiles and supporting scripts.
11.13 Firmware Provisioning
The Oracle Enterprise Manager Ops Center provisioning feature installs firmware on the managed hardware assets. You initiate the installations from the UI, rather than from the asset itself.
Oracle Enterprise Manager Ops Center provides default profiles for configuring firmware for servers and for disk storage. An alternate procedure is to create a Firmware Report. You then use the report results to update the firmware.
The benefit of using a profile to install firmware is that the firmware is installed consistently, no matter how many assets you provision. The benefit of using the Firmware Compliance Report is to identify the firmware on a specific asset or set of assets.
11.13.1 Firmware Profiles
The general procedure for provisioning firmware has the following steps:
-
Import a file with the firmware and the associated metadata into a software library, according to the procedure in Keeping Your Firmware Up-to-Date in the Operate How To library at http://docs.oracle.com/cd/E40871_01/nav/operatehowto.htm.
-
Create a firmware profile, based on one or more firmware images, according to the procedures in Keeping Your Firmware Up-to-Date in the Operate How To Library at http://docs.oracle.com/cd/E40871_01/nav/operatehowto.htm.
-
Shut down the server gracefully. Most firmware requires that the server is not running when the firmware is updated. Most firmware images include a power-off command for a running server, which causes a hard shutdown of the server.
-
Apply the firmware profile.
11.13.2 Firmware Compliance Reports
The Firmware Report feature compares the firmware images specified in a firmware profile to the firmware images installed on one or more hardware assets.
The report shows whether a target asset is compliant, not compliant, or not applicable:
-
A compliant asset has the firmware images specified in the profile.
-
A non-compliant asset does not have the same firmware images as specified in the profile. Update the firmware by either clicking the Make Targets Compliant button in the Interactive report or using the procedure in Updating Firmware.
-
A non-applicable asset indicates that a firmware image in the profile does not match the model of service processor in the asset. This condition can occur when either the profile does not recognize the model of the service processor or the profile includes firmware images that are not designed for the service processor.
-
Compare the model of the service processor displayed in the asset's Summary tab with the model of the service processor included in the profile. If they are different, add the name in the profile to the asset's data.
-
When the firmware profile was created, only images that matched the service processor could be included. However, if the service processor did not report all the firmware types it supported, an image that did not match the service processor could have been included in the profile. To update the Oracle Enterprise Manager Ops Center software with all the service processor's supported firmware types, use the Refresh action. When the job is completed, view the service processor's Summary tab to see all firmware types.
-
Create a new firmware compliance report.
-
See Creating a Firmware Report for the procedure to create the report.
11.13.3 Updating Firmware
To update the firmware on one or many assets, you use a deployment plan to apply a firmware profile for the type of asset. For a server, the profile updates the firmware on a service processor, and restarts the service processor and operating system. For storage components, profiles update firmware on a RAID controller, an expander, or disk.
To see the deployment plans that update firmware, expand the Deployment Plans section of the Navigation pane and then click Firmware. A list of existing plans and profiles is displayed.
To update the firmware of one asset, an alternative to a deployment plan is to use the Update Firmware action. Select the asset from the Asset section of the Navigation pane and then click Update Firmware in the Actions pane.
The software library must contain the images that provision the firmware. Perform the Uploading a Firmware Image procedure in the Keeping Your Firmware Up-to-Date document in the Operate How To library at http://docs.oracle.com/cd/E40871_01/nav/operatehowto.htm.
If you are updating the firmware on a server, shut down the server before you update the firmware. A firmware update to a server's service processor usually requires that the server is not running. If you start to update the firmware on a running server's service processor, the procedure performs a hard shutdown of the server.
Requirements for ALOM Service Processors and M-Series Servers
The firmware provisioning process for M-Series servers and servers that have ALOM service processors relies on a temporary account that performs an FTP operation.
Note:
Advanced Lights Out Management (ALOM) is a Sun Microsystems standard for servers such as: SunFire V125/V210/V215/V240/V245/V250/V440/T1000/T2000, Sun Netra 210/240/440, and SunBlade T6300.If your site does not allow a temporary account, use the following procedure to prepare for the provisioning operation:
-
On the Enterprise Controller, open the
/var/opt/sun/xvm/hal.propertiesin an editor. -
Add the following properties to the file:
ftp.user.name=username
ftp.user.password=password
-
Restrict access to the file to root user:
chmod 600 /var/opt/sun/xvm/hal.properties
-
On the Proxy Controller that provisions the firmware, enable the
ftpservice on Oracle Solaris or thevsftpdservice for Oracle Linux systems.
You can now apply the firmware provisioning deployment plan. The FTP operation retrieves the credentials from the file.
If a network failure occurs while updating the firmware, repeat the firmware update procedure. If you do not repeat the procedure, the firmware inventory list might be incomplete.
Option for Deferring the Stop and Restart of the Operating System and Server
The procedure is available for Oracle Solaris 10 Update 10 operating systems running on servers with the ILOM x86 (3.0 and higher) service processor.
When you update the firmware of a service processor, the procedure stops the operating system and the server before the update and restarts them after the update so that the new BIOS takes effect. If you prefer to stop and restart at a convenient time, keeping the current BIOS in effect, use the following procedure to change the action of both Oracle Enterprise Manager Ops Center and the firmware's metadata:
-
On the Enterprise Controller, open the
/var/opt/sun/xvm/hal.propertiesin an editor. -
Add the following property to the file:
ilom.fwp.skipAutoReboot=true
-
On the Proxy Controller that provisions the firmware, enable the
ftpservice on Oracle Solaris or thevsftpdservice for Oracle Linux systems. -
At a later time, reboot the servers.
11.13.4 Launching LOM and XSCF Browser User Interfaces
When you select a server on the Assets pane, the Launch LOM Controller link is displayed on the Actions pane. This functionality launches the Browser User Interface (BUI) for servers with a Lights Out Management (LOM) port.
The Launch SP Controller link is only available to M-Series servers on the Actions pane for launching the specific BUI for the XSCF controller. The BUI is disabled by default on M-Series servers for security reasons and must be manually enabled before attempting to use this functionality.
The BUI for XSCF runs on the HTTPS protocol and can be enabled using the following command with a user with platadm privileges:
XSCF> sethttps -c enable
11.14 Related Resources for Hardware Management
For instructions in performing actions or to learn more about the role of this feature, go to one of the following resources:
-
For end-to-end examples see the Deploy How To library at http://docs.oracle.com/cd/E40871_01/nav/deployhowto.htm and the Operate How To library at http://docs.oracle.com/cd/E40871_01/nav/operatehowto.htm.
-
For more information about Oracle Datacenter and Ethernet switches, see: >
>http://www.oracle.com/technetwork/documentation/oracle-net-sec-hw-190016.html#legacysecapp. -
See the Power Distribution Units User's Guide at http://docs.oracle.com/cd/E19844-01/index.html.
-
For information about Oracle SPARC servers, including SPARC T5, SPARC M5-32, and SPARC M6-32 servers, see SPARC Systems at >
>http://www.oracle.com/technetwork/documentation/oracle-sparc-ent-servers-189996.html. -
See Systems Management and Diagnostics at http://www.oracle.com/technetwork/documentation/sys-mgmt-networking-190072.html for information about ILOM configurations.