12 Operating System Management
This chapter provides an overview of the operating system (OS) management features that are available in Oracle Enterprise Manager Ops Center.
The following information is included:
See Chapter 13, "Operating System Provisioning" for how to install, or provision operating systems. See Chapter 14, "Operating System Updates" for information about patching and updating your operating systems.
12.1 Introduction to Operating System Management
Oracle Enterprise Manager Ops Center provides comprehensive lifecycle management for Oracle Solaris and Linux operating systems in your datacenter. The software also enables you to patch, or update, Microsoft Windows operating systems.
The discovery feature makes adding operating systems and other assets quick and easy. After the operating systems are added, they are considered managed and you can begin using the monitoring, analytics, OS provisioning, and update features to gather information and perform tasks.
Your managed operating systems are visible in the All Assets section of the user interface. The operating system appears under the service processor and hardware, as shown in Figure 12-1.
Figure 12-1 Managed System and Operating System
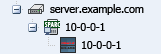
Description of "Figure 12-1 Managed System and Operating System"
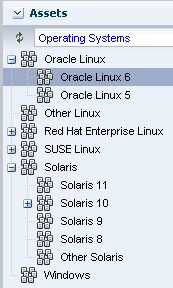
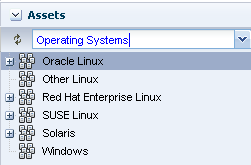
The operating system also appears in the appropriate platform-specific group in the Operating Systems view, as shown in Figure 12-2.
You can create user-defined groups and subgroups to refine your administration tasks. For example, you might want to create groups for Critical Systems, Training, Region 1 and Region 2. Groups are useful when you want to organize the systems to apply different monitoring standards, implement update requirements, or job scheduling times. You can create rules for your groups to automatically add existing and newly managed operating systems to the correct group or subgroup. See Chapter 2, "Asset Management" for details on using the discovery feature to add assets and for more information on creating user-defined groups.
Two types of OS management are available: agent managed and agentlessly managed. In some cases, the features and actions that you can perform on an operating system are determined by the management type. See Using Agent Management for Operating Systems for more information about the features available for agent and agentlessly managed operating systems.
The following features are available for operating systems:
-
Monitoring: A series of monitoring rules and parameters monitor your managed assets. Alerts and incidents are raised for components that are not performing as expected.
-
Performance: Analytics provides you with a detailed view into OS performance.
-
System resource graphs, processes information, and a view of the top consumers
-
Resource usage of virtualized OS instances
-
-
Provisioning: Install Oracle Solaris or Linux operating systems onto your systems, making it easy to install one system or many servers simultaneously.
Note:
The Enterprise Controller must be installed on an Oracle Solaris operating system in order to perform the following tasks:-
Provision Oracle Solaris 10 using JET customization.
-
Provision Oracle Solaris 11 (requires that both the Enterprise Controller and Proxy Controller are running on an Oracle Solaris 11 operating system.
-
Provision Oracle VM Server for SPARC (control domain).
-
-
Manage Oracle Solaris Boot Environments: Create and manage Oracle Solaris boot environments in a repeatable and consistent manner from a single user console.
-
OS Updates: Apply update packages to keep your operating systems up-to-date. See Chapter 14, "Operating System Updates" for information.
-
Reports and Snapshots: A variety of reports are available for your operating systems. See Chapter 10, "Reports" for OS reports. See Chapter 14, "Operating System Updates" for information on how to use the System Catalogs to maintain snapshots of your operating system.
The monitoring feature provides extensive monitoring capabilities that are enabled as soon as you begin managing an operating system. A series of three escalating status levels notifies you when something is not operating as expected. The first level is informational, then warning, and finally a critical status.A set of default monitoring attributes and alert triggers are included with the software. You can tune the monitoring thresholds and triggers to define what you want to generate an alert and when. You can create custom monitoring rule sets and alert parameters and apply the customized monitoring rules to a specific operating system, a group of homogeneous operating systems, or a group that you define, such as critical systems or regional systems.
The Analytics feature provides extensive information about a specific operating system in one location so that you can maximize performance and utilization. The Analytics information includes process details, defined monitoring thresholds for operating systems, metrics and historical information on the top consumers, and a extensive list of metrics data. The Summary contains details on the top five consumers for CPU, memory, network, and I/O utilization. Use the graphical representation to quickly view utilization trends and high resource consumers. You can drill down to get detailed utilization and process information, and kill a process that is consuming too many resources.
12.2 Roles for Operating System Management
Table 12-1 lists the tasks that are discussed in this section and the role required to complete the task. An administrator with the appropriate role can restrict privileges to specific targets or groups of targets. Contact your administrator if you do not have the necessary role or privilege to complete a task. See the Oracle Enterprise Manager Ops Center Administration Guide for information about the different roles and the permissions they grant.
Table 12-1 OS Management Roles and Permissions
| Task | Role |
|---|---|
|
Reboot an OS |
Asset Admin |
|
Charts and Utilization |
Asset Admin Cloud Admin |
|
Analytics |
Read Asset Admin |
|
Kill action in Analytics |
Operating System Management |
|
Update Management Credentials |
Security Admin |
|
Any Actions related to changing credentials |
Security Admin |
|
Import image |
Storage Admin |
|
Upload image |
Storage Admin |
|
Unconfigure, SCCM Configuration |
Oracle Enterprise Manager Ops Center Admin |
|
Reboot, upgrade Agent Controller |
Asset Admin |
|
Edit Tags |
Asset Admin |
|
Edit Attributes |
Asset Admin |
|
View Boot Environment |
Read Asset Admin Update Admin |
|
Create Boot Environment |
Asset Admin Update Admin |
|
Update an Alternate Boot Environment |
Update Admin |
|
Activate and Reboot a Boot Environment |
Asset Admin Update Admin |
|
Synchronize Boot Environments |
Asset Admin Update Admin |
|
Delete an Alternate Boot Environment |
Asset Admin Update Admin |
|
Monitor Boot Environment Attributes |
Asset Admin |
12.3 Actions for Operating System Management
You can manage an operating system in one of two modes: agent managed or agentless managed. The management mode determines the features that are enabled for your operating system.
Agent managed is the more robust management mode because the Agent Controller enables a greater level of communication with the Proxy Controller and Enterprise Controller than the agentless managed operating systems. You can use the features and perform the actions described in this chapter with an agentless managed operating system, but OS update functionality requires an agent managed operating system. You can manage your operating systems by installing an Agent Controller on the OS or by using SSH to perform tasks. See Using Agent Management for Operating Systems for more details on managing operating systems with or without an Agent Controller.
See Chapter 2, "Asset Management" for details on using the discovery feature to add assets and for more information on creating user-defined groups.
After you manage your assets, you can perform the following actions:
-
Monitor your physical and virtual operating systems.
-
View OS utilization for Oracle Solaris and Linux operating systems.
-
Manage Oracle Solaris boot environments.
-
Update or patch operating systems. See Chapter 14, "Operating System Updates".
-
Provision or upgrade Oracle Solaris and Linux operating systems. See Chapter 13, "Operating System Provisioning".
Note:
To perform actions, such as OS provisioning, updating, and managing boot environments, on an Oracle Solaris 11 operating system, the Enterprise Controller and Proxy Controller must be installed on an Oracle Solaris 11 operating system.12.4 Location of Operating System Management Information in the User Interface
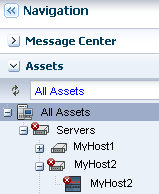
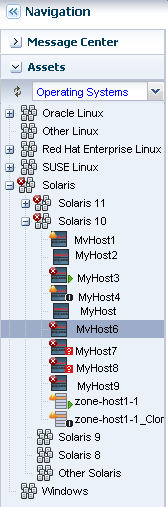
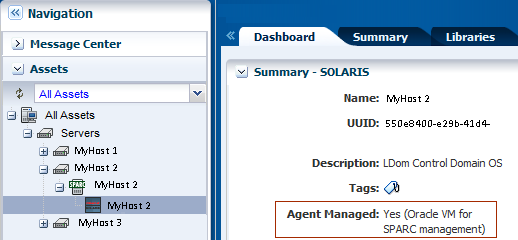
When you manage a physical or virtual operating system, it appears under the associated server in the All Assets view, as shown in Figure 12-3 and it appears in a special pre-defined operating system group, as shown in Figure 12-4.
Operating systems are automatically added to a homogenous group of operating systems. The group contains directories for each release. In Figure 12-4, the list of Oracle Solaris 10 operating systems includes physical operating systems, virtual hosts, and zones. You can add user-defined groups and create rules to automatically add newly discovered assets to that group, or you can manually add them at any time. See Using Groups for details.
To view information about a specific OS, select the OS from the Assets pane. OS details appear in the tabs across the center pane.
Table 12-2 Location of Operating System Information in the UI
| To Display | Select |
|---|---|
|
Managed operating systems |
Expand the Assets pane. Each operating system appears in the Assets Navigation tree under the system on which it is installed. To only view operating systems, click the drop-down next to All Assets and select Operating Systems. The systems are grouped by platform. |
|
Operating system details for a specific operating system |
Select an operating system in the Assets pane, then click the Summary tab. |
|
Operating system details for a group of operating systems |
Select an operating system in the Assets pane, then click the drop-down next to All Assets and select Operating Systems. Select a group, then click the Summary tab. |
|
Unresolved incidents and alerts for a specific operating system |
Select an operating system in the Assets pane, then click the Incidents tab. The details are in the Unresolved Incidents and Alert subtabs. |
|
Unresolved incidents and alerts for a group of operating systems |
Expand the Assets pane, then click the drop-down next to All Assets and select Operating Systems. Select a group, then click the Incidents tab. The details are in the Unresolved Incidents and Alert subtabs. |
|
Monitoring Rules for a specific operating system |
Select an operating system in the Assets pane, then click the Monitoring tab. |
|
Monitoring Rules for a group of operating systems |
Select an operating system in the Assets pane, then click the drop-down next to All Assets and select Operating Systems. Select a group, then click the Monitoring tab. |
|
Analytics |
Select an operating system in the Assets pane, then click the Analytics tab. |
|
Boot environments |
Select an operating system in the Assets pane, then click the Boot Environments tab. |
12.5 Viewing Operating Systems
You can view all managed assets in the Assets section of the Navigation pane, or you can filter to display a specific group of assets. Figure 12-5 shows the asset filter menu where you can choose the Operating System group or user-defined groups.
See Using Groups for information about creating user defined groups.
Displaying Operating System Details
Details about a specific operating system appear in a number of tabs in the center pane of the UI. The tabs and contents might vary based on the type of operating system selected and whether the operating system is agent or agentlessly managed. When a tab is not applicable, it will not appear in the UI. For example, the Libraries tab does not appear when there are no libraries associated with the operating system.
To view the details in the UI, perform the following steps:
-
Expand Assets in the Navigation pane.
-
To display All Assets, expand Servers.
-
To display the Operating System groups, select Operating Systems from the menu.
-
To display user-defined groups, select All User Defined Groups from the menu, then select the group.
-
-
Select an operating system in the Navigation pane.
The following tabs appear in the center pane:
-
Dashboard: Displays the summary of the selected operating system, including the name, server name, whether the operating system is agent managed, the number of unassigned incidents, the current alert status, and the OS release. The dashboard also includes the operating system's membership graph, the status of incidents, and compliance reports, if any.
-
Summary: Displays the name of the selected Oracle Solaris operating system, description, server name, operating system version, number of CPU threads, active boot environment, the state, the length of running time, and zone patching information. Tables display total CPU utilization and total ZPool Utilization for Oracle Solaris operating systems.
-
Libraries: Displays library details when a library is associated with an operating system. See Chapter 5, "Software Libraries" for more information.
-
Storage: Displays logical unit (LUN) details and iSCSI targets, when applicable. LUN details include the initiator, MPxIO details, the GUID, type, size, status, vendor, and product. The iSCSI details include the initiator, iSCSI target address, address type, port, and IP address. You can discover iSCSI addresses from this tab. See Block Storage for more information.
-
Analytics: Displays utilization and metrics for the selected operating system and zones, when applicable. See Using Analytics for more information.
-
Connectivity: Displays Linux OS network interface of the system, including network connectivity and aggregated links. See Network Connectivity for more information.
-
Networks: Displays Oracle Solaris network connectivity, IPMP groups, and aggregated links. For an Oracle Solaris 11 OS, the tab also provides bandwidth management. See Network Connectivity and Bandwidth Management.
-
Incidents: Displays all incidents reported from the selected operating system. See Chapter 9, "Incidents" for more information.
-
Monitoring: Displays the alert monitoring rules and service dependencies of the selected operating system. Chapter 4, "Monitoring Rules and Policies" for more information.
-
Terminal: Enables you to establish an SSH connection to the terminal window.
-
Boot Environments: Displays Oracle Solaris boot environment details, including all available boot environments, the active and enabled boot environment, the size, and the creation or synchronization date. For a selected boot environment, you can view snapshot details, file system details, and any associated zone boot environments. This tab is only available for Oracle Solaris operating systems. See Overview of Oracle Solaris Boot Environments for more information.
-
Jobs: Displays current and historical job information for that operating system. See Chapter 3, "Jobs" for more information.
-
Service Request: Displays the service request for the selected operating system. See Using Oracle Services and Service Requests for more information.
-
Configuration: Displays access points, or resources, that are associated with the operating system. See Using Access Points for more information.
-
12.6 Operating System Profiles
The following categories of OS profiles are available:
-
OS Provisioning
-
Monitoring Profile
-
Oracle Solaris Zone
-
Boot Environments
12.7 Using Agent Management for Operating Systems
An agent managed operating system has an Agent Controller or a specialized virtualization, or VC, Agent Controller installed to gather information for the Enterprise Controller. The VC Agent Controller is for virtualization technology, such as zones and logical domains.
When you install the Agent Controller on the operating system, the following actions occur:
-
The software registers the Agent Controller with the Enterprise Controller. It takes at least five (5) minutes for the software to register the Agent Controller. After registered, you can update the operating system.
-
The software sends you a notification when it has enabled the update function for the operating system.
-
The Agent Controller checks the inventory of patches and packages and creates the System Catalog. The catalog lists the patches and packages, and the versions that are currently installed on the operating system.
12.7.1 Virtualization Agent Controllers
In addition to the default Agent Controllers, Oracle Enterprise Manager Ops Center uses specialized virtualization Agent Controllers called VC Agent Controllers for Oracle VM Server and Oracle Solaris Zone assets.
You can install the agent during discovery, or at any time after discovery. You have the following agent management options:
-
Oracle VM Server for SPARC Virtualization Controller Agent: Manages the logical domains that are running on the Control Domain. The Oracle VM Server, Control Domain and operating system are reflected in the UI. Using this agent enables full monitoring and management actions for the Oracle VM Server system.
-
Zones Virtualization Controller Agent: Manages the zones that are running on the logical domains. The global zone is reflected in the UI. Using this agent enables full zone monitoring and management actions.
-
Agentlessly: Limited management functionality is available with this method. Information is gathered by using SSH connection between the logical domains and the Proxy Controller.
For robust management, use the OVM Server for SPARC Virtualization Controller Agent to manage the domains. The agent runs on the Control Domain and monitors the configuration and reflects any changes on the configuration in its copy of the metadata.
12.7.2 Functionality With and Without Agent Controllers
The Agent Controller provides the most robust management features. However, you can manage your assets without using an Agent Controller. To gather information on an agentlessly managed operating system, the Proxy Controller uses SSH to perform certain tasks and periodically check on the operating system.
Some features are not available when the operating system is managed agentlessly. Table 12-3 shows the information that are available for each management type.
Table 12-3 Information Available for Agent Managed and Agentlessly Managed Assets
| Tab or Feature | Agent Managed | Agentlessly Managed |
|---|---|---|
|
Dashboard |
Yes |
Yes |
|
Summary |
Yes |
Yes |
|
Libraries |
Yes |
No |
|
Storage |
Yes |
No |
|
Utilization |
Yes |
Yes |
|
Analytics |
Yes |
Limited |
|
Virtualization Analytics for Oracle VM Server |
Yes, if the guest is agent-managed |
No |
|
Virtualization Analytics for Oracle Solaris 10 Zones |
Yes, if the global zone is agent-managed or if the non-global zone is agent-managed. |
No |
|
Networks |
Yes |
No |
|
Incidents |
Yes |
Yes |
|
Monitoring |
Yes |
Yes |
|
Charts |
Yes |
Yes |
|
Reports |
Yes |
No |
|
System Catalogs |
Yes |
Oracle Solaris 11: Yes Oracle Solaris 8-10, Linux, Windows: No |
|
Terminal |
Yes |
No |
|
Jobs |
Yes |
Yes |
|
Configuration |
Yes |
Yes |
|
OS update |
Yes |
Oracle Solaris 11, Windows: Yes Oracle Solaris 8-10, Linux: No |
|
OS provisioning |
Yes |
Yes |
|
Zone management: boot, shutdown, halt, delete, edit zone config, get zone console |
Yes |
Yes |
|
Zone management: create, clone, migrate, add a filesystem to a zone, remove a filesystem from a zone, attach and detach networks, add storage to a zone |
Yes |
No |
12.7.3 Switching Between Agent Controllers or Agent and Agentless
The current management mode of an operating system and the type of Agent Controller appears on the Dashboard for the operating system, as shown in Figure 12-6.
You can use the following methods to change the agent management mode:
-
Unmanage the asset, then rediscover the operating system using a profile with the alternative mode.
-
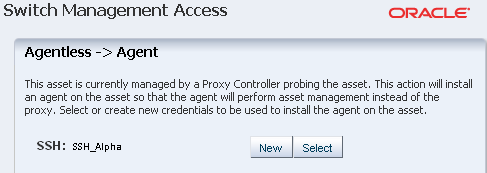
Use the Switch Management Access feature.
The Switch Management feature enables you to move back and forth from agentlessly managed to agent managed or to switch the type of agent.
When the operating system is agent managed and you use this action, the software removes the Agent Controller and changes the operating system to agentless. Select or create new credentials for the Proxy Controller to use to obtain information from the asset.
To switch between different types of Agent Controllers, such as changing from a default Agent Controller and a virtualization Agent Controller, you must use Management Access to unmanage and then manage again. When you manage the asset, you are prompted to choose the type of Agent Controller when it is not apparent to Oracle Enterprise Manager Ops Center which agent you want to install.
To Use Switch Management Access
-
Expand Assets in the Navigation pane.
-
Expand the Assets tree, then select the operating system.
The current management status appears in the Dashboard tab.
-
Click Switch Management Access in the Actions pane.
-
Add or select the credentials for the system, then click Finish.
-
(Optional) To create a new set of credentials, click New and complete the Create Credentials Wizard, then click OK.
-
(Optional) To select from a list of existing credentials, click Select, highlight the credentials from the list of available credentials, then click OK.
Figure 12-8 Switch Management Access Credentials
Description of "Figure 12-8 Switch Management Access Credentials"
-

12.8 Monitoring Operating Systems
The software monitors the status of your operating systems right after asset discovery. Oracle Enterprise Manager Ops Center uses the default rules and thresholds. Monitoring rules state the values and boundaries for an asset's activity. A monitoring policy is a set of rules. You can change the rules or thresholds to adjust the type and level of monitoring you want. Analytics provides details on operating system activity and utilization.
A monitoring policy defines alert configurations to be performed on one or more managed resources. A policy is for a specific type of resource, such as operating systems. A more specific policy might apply to all Oracle Solaris operating systems. Each monitoring policy contains several alert monitors for a specific type of resource. Alert monitors watch the state of managed resources and their attributes and raise an alert when the state is outside the pre-defined thresholds.
Applying a monitoring policy to all the assets enforces consistency. Each monitoring policy contain rules for threshold levels. Default policies for monitoring hardware, operating systems, and Oracle Solaris Clusters are included in the software. You can use the default policies, but you cannot edit them. To edit or add monitoring rules to a monitoring policy, you must make a copy. Modifying a monitoring rule for a specific asset creates a custom set of monitoring rules for the asset.
See Chapter 4, "Monitoring Rules and Policies" for information about how to change the threshold limits and how to change the deactivate or activate the auto delete policy. See Chapter 9, "Incidents" for details about how incidents are generated, severity badges, how to assign and close an incident.
12.9 Using Analytics
The Analytics feature provides a view into operating system and zone performance and status. The charts, reports, and utilization data provide details of an individual eligible operating system or zone. You can use the information to analyze the behavior of an operating system to aid in peak performance and to diagnose and correct incidents.
Monitoring uses the Agent Controller to gather information. When an operating system is not an agent-managed system, or it is Microsoft Windows, the software uses an SSH connection from a Proxy Controller to perform remote monitoring. Remote monitoring over an SSH connection limits the available metric information. The Summary view, Process view, Historical view and Virtualization Analytics are not available for these operating systems.
The Analytics view provides information for the following agent-managed platforms:
-
Linux
-
Oracle Solaris 11 and 10 OS
-
Oracle Solaris 10 non-global zone, when the global zone or non-global zone is agent-managed
-
Oracle Solaris 11 non-global zone, when the global zone is agent-managed
When your operating system is agentlessly-managed, information is not available for zones and less information is available for Linux and Oracle Solaris 10 and 11 operating systems. Table 12-4 shows a list of features and whether the feature is supported on an agent-managed or agentlessly-managed asset.
Table 12-4 Supported Analytics Information
| Feature | Supported on Agent Managed OS | Supported on an Agentlessly Managed OS |
|---|---|---|
|
Yes |
Yes |
|
|
Virtualization Analytics for Oracle VM Server |
Yes, for agent-managed guests |
No |
|
Virtualization Analytics for Oracle Solaris 10 Zones |
Yes, for an agent-managed global zone or non-global zone |
No |
|
Services |
Yes |
Yes |
|
Processes |
Yes, for an agent-managed guest, global zone, or non-global zone |
No |
|
Threshold |
Yes |
Yes |
|
History |
Yes, for an agent-managed guest, global zone, or non-global zone |
No |
|
Metrics |
Yes |
Yes |
The current management mode appears in the Dashboard Summary page for the operating system. See Using Agent Management for Operating Systems for details and for the steps to switch the management mode.
12.9.1 Displaying Analytics Information
For each operating system, the information appears in the Analytics tab in the center pane.
The following diagnostic pages are available for an agent-managed operating system:
-
OS Analytics view: Displays analytics details for an operating system.
-
System resource graphs
-
Top-consumers views
-
Processes information
-
View historical data and set thresholds
-
-
Virtualization Analytics view: Displays analytics details for a zone.
-
Virtualized OS instance
-
Breakdown of resource usage of the physical server
-
Running OS instance
-
View historical data and set thresholds
-
-
Select an operating system, zone, or guest in the Navigation pane.
-
Click the Analytics tab.
To Display the Both the OS Analytics and Zone Analytics Views
-
Select a global zone that has zones in the Navigation pane.
-
Click the Analytics tab to see the OS Analytics.
-
Click the Zones Analytics tab to view the Summary, Zones, History, and Resource Pool Utilization for all zones of the global zone.
-
See Displaying Virtualization Analytics for information about analytics for virtualized platforms.
The Analytics view contains current and historical information about an operating system's use of resources, including CPU, Network, disk I/O, memory, alert history, and total thread and process counts. Information presented in this section assumes that the operating system is agent managed. See Table 12-4 for the list of supported features for an agentlessly managed OS.
The information appears in a series of charts in the following subtabs:
-
Summary: View a high-level overview of the top consumers, by process, for the CPU, memory, network, and disk I/O resources. See Displaying the Analytics Summary for details.
-
Processes: View process-specific details. See Displaying the Processes View for details.
-
Services: View and monitor Oracle Solaris 10 and 11 SMF services. See Displaying the Services View for details.
-
Thresholds: View and edit the threshold limits for a selected monitored attribute. See Displaying Thresholds for details.
-
History: View a history for the top consumers. See Displaying Historical Data for details.
-
Metrics: View specific details an operating system element, such as the percentage of memory used. See Displaying Metrics for details.
-
Charts: You can create a variety of utilization charts, define the coordinates, and export the chart data to CSV or XML output. See Displaying and Creating Charts for details.
You can view analytics information for all supported and managed operating systems, both physical and virtual. The information presented varies, depending on the data available for the OS. For example, when the System Tap is not installed on a Linux operating system, information about the top network and I/O consumers might not be available. Also, the top consumers for I/O data might not be available with some versions of the Linux kernel.
When an agent-managed operating system is on a virtualization platform, you can view the information in the Analytics view of the virtualization platform. See Displaying Virtualization Analytics for information about analytics for virtualized platforms.
12.9.2 Displaying the Analytics Summary
The Summary view provides details for an individual operating system. The Summary provides a graphical representation and a list of the top five (5) resource usage consumers, by process, for the CPU, memory, network, and disk I/O resources. Click the View icon for a row to display process details.
The following details appear in the Summary view:
-
CPU Utilization: A graph of the percentage of CPU Utilization over time and a detailed list of the top five (5) CPU processes. The list includes the process identification number (PID), name, and CPU Usage %.
-
Memory Utilization: A graph of the top 5 memory processes, including the PID, the process name, and the percentage of memory used.
-
Network Utilization: A graph of the top 5 network processes, including the PID, the process name, and the network usage in Kilobytes (KB) per second.
-
I/O Utilization: A graph of the top 5 I/O processes, including the PID, the process name, and the I/O usage per second.
Oracle Enterprise Manager Ops Center collects information every five minutes on every managed asset and displays the last hour of data on the Summary tab. Each list has an icon before the PID column for each process. Click an icon to view details of the process. The type of resource determines the available details.
-
Process Details: Includes the contract ID, Service FMRI, creator, elapsed time, project name, project ID, and a process tree.
-
Thread Information: Includes the thread's light-weight process (LWP) ID, the number of threads (NLWP), the user, the priority, the state (such as sleeping), the percentage of CPU used, the CPU time, the percentage of memory used, how much memory the process has marked for allocation (VSZ memory), the processors, and the command.
-
Handles: Includes the port details, such as the family, local address, local port, the protocol, remote address, remote port, device, and node.
-
Process Environment: Includes details about the environment, such as the arguments, data model, and flags.
-
Memory Information: Includes physical, virtual, and anonymous memory and dirty page details. Details include the virtual address and the number of KB in the virtual mapping size, the resident physical memory, the anonymous memory, and the dirty pages. The lock status, permissions, and mapping name details are displayed, when available.
See Displaying and Creating Charts to create a chart with different values for the x and y axis of the graph and to export the chart data.
Displaying and Configuring Graphs
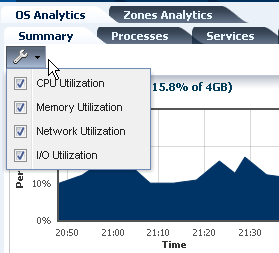
When the icon that looks like a wrench appears on a page with graphs, click the icon to configure the graphs or change the graphs that appear on the page. Figure 12-9 shows an example where you can choose the system resource graphs that display on the Summary page.
12.9.3 Displaying the Processes View
You can drill down to display process-specific data, based on current data from the operating system. Some data, such as CPU usage, might also be available in the History view.
The following details are available in the Process view:
-
Process ID (PID)
-
Process Name
-
User
-
State
-
CPU Usage %
-
Memory Usage %
-
Physical Memory size in MB
-
Virtual memory size
-
Target
When you click a process in the Processes table, two icons are enabled in the center pane, one to view more details and the other to kill the process. Figure 12-9 shows an example where you can click check boxes to select or deselect system resource graphs from displaying on the Summary page.
When the software is configured to work with Oracle Enterprise Manager Cloud Control, information about available Oracle Enterprise Manager Cloud Control targets appears in the Process view.
12.9.4 Displaying the Services View
The Services tab provides a view of Oracle Solaris 10 and 11 Service Management Facility (SMF) services. The Oracle Solaris SMF feature defines the relationships between applications, or services, and is a method of managing them by providing a framework for startup scripts, init run levels, and configuration files. Each service is identified by a Fault Managed Resource Identifier (FMRI).
The Services tab contains SMF service instances, state, dependencies, and severity information. You can drill down to see specific service details, including the configuration, dependencies, and the processes that are in the service contract.
The following actions are available from the Services tab:
-
View a list of services currently installed and their states
-
View a list of dependencies and dependents for FMRI
-
View the relationship between services and processes
-
View details about why a service is not available
-
Obtain logs for debugging
-
Clear faults for FMRI
-
Invoke the disable, enable, and restart actions on FMRI
-
Read configuration files
Services information is available for agent managed and agentlessly managed Oracle Solaris 10 and 11 operating systems, including global and non-global zones.
12.9.5 Displaying Thresholds
The Thresholds tab contains information about all monitored attributes for the selected operating system, including per-instance attributes such as File System Usage for each file-system on the asset.
-
Display the Analytics view.
-
Click the Thresholds tab.
-
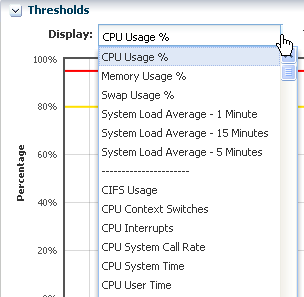
Click the Display menu to show the available monitored attributes.
Figure 12-10 shows a partial list of the monitored attributes available for display.
Charts for the historical data of those attributes show the alert monitor threshold levels, if configured, for that attribute. Figure 12-11 shows the chart for the System Load Average - 5 minutes. The time frame selected is Live. Under the chart are the severity levels for this monitored attribute (SystemLoad.average15MinutePerCpuCore), the operator, and the threshold values. Instead of editing the thresholds in the Monitoring tab, you change the values on this page. You can either add values in the New Value column or click Suggest Thresholds to populate the fields with suggested values. Click Apply Thresholds to change the existing thresholds.
Note:
When the threshold monitor is modified, the asset is removed from the default monitoring profile and a custom profile created.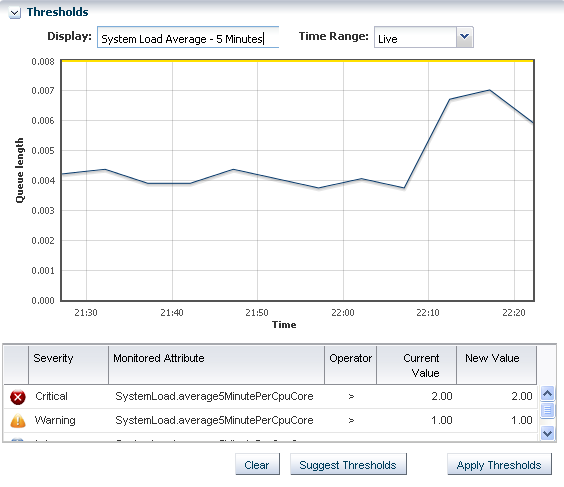
12.9.6 Displaying Historical Data
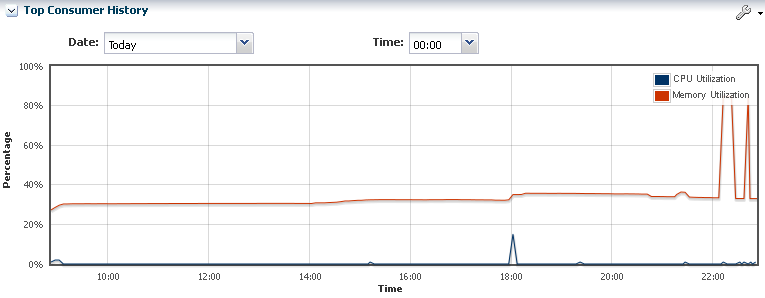
The History tab contains the history for the top consumers. By default, the current date displays. The time selection box is used to select a time of day for which the top consumer processes are listed. It does not affect the chart, which can only show discrete intervals of 1 hour, 1 day, 5 days, 3 weeks, 6 weeks, and 6 months. The history chart displays the most applicable chart interval for the selected date and time. Figure 12-12 is an example of a Top Consumer History chart.
-
Display the Analytics view.
-
Click the History tab.
-
Click the wrench icon to select from a list of options to chart.
12.9.7 Displaying Metrics
The Metrics tab provides you with specific details about various operating system statistics, such as the percentage of memory used, and view graphs. When monitoring thresholds are enabled for an element, you can reset the thresholds. When an element does not have a monitoring threshold, you can configure a new monitoring threshold.
-
Display the Analytics view.
-
Click the Metrics tab to see OS-specific components.
The following are the categories of component details available for an agent-managed Oracle Solaris OS:
-
Load
-
File Systems
-
Networks
-
Users
-
Buffer Activity
-
Disk Usage
-
Paging Activity
-
Message Activity
-
Tables Status
-
TTY Activity
-
Kernel Memory
-
DNLC
-
IPC Message Queue
-
IPC Shared Memory
-
IPC Semaphore Usage
-
CPU Detail
-
File Access
-
Disk Errors
-
Memory Utilization
-
-
Expand a component to view the available elements.
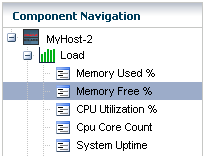
Click an element to view the details. In Figure 12-13, the Load component is expanded and the elements, such as percentage of memory used, CPU utilization percentage, CPU core count, and system update options are available in the Load list. Memory Used % is selected and the details and a graph are visible.
The type of resource determines the available details. Figure 12-14 is an example of the details and graph for the Memory Used % element. This example shows a system in trouble. The Details shows the last known value memory usage at 95.59111 percent and the established monitoring parameters. A warning incident is generated at 80 percent and a critical incident is generated when the used memory reaches 95 percent.
View the bar graph to see how the memory usage has trended over the selected time period. The yellow and red horizontal lines indicate the warning and critical thresholds.
Figure 12-14 Memory Used % Details and Graph

Description of "Figure 12-14 Memory Used % Details and Graph"
The wrench icon appears above the graph. For this graph, you can click the icon to change the graph style to line, bar, or area. You can also change the definition of the X axis from 1 day to 1 hour, 5 days, 3 weeks, 6 weeks, or 6 months. The export icon enables you to export the graph to file in CSV or XML format.
You have the opportunity to reset the threshold values for the monitoring rule from this page, or to view recommended threshold values based on past performance. When you click the Set Thresholds button, you are taken to the Thresholds tab, where you can enter new threshold values. When the Thresholds tab appears, the drop-down menu contains the name of the monitored attribute from the metrics view, and the associated chart appears. Editing a threshold value creates a custom set of monitoring rules for the asset. See Chapter 4, "Monitoring Rules and Policies" for more information about editing individual monitoring rule parameters and creating a custom monitoring policy.
12.9.8 Displaying and Creating Charts
The Charts tab enables you to modify the following charts to change the type of chart and to see utilization data over longer periods of time, up to six months:
-
Power Utilization: Servers, chassis
-
CPU Utilization: Operating system, operating system for a virtualization host, virtual host, server pool
-
Memory Utilization: Operating system, virtual host, server pool
-
Network Utilization: Operating system, operating system for a virtual machine, virtualization host, server pool
-
File System Utilization: Oracle Solaris OS and Linux OS
-
System Load: Oracle Solaris OS and Linux OS
For the first five days of operation, Oracle Enterprise Manager Ops Center collects data every five minutes. After the fifth day, the reported data is an average, according to the following:
-
Five days to three weeks: Average for each hour
-
Three weeks to six weeks: Average for each 12-hour period
-
Six weeks to six months: Average for each 24-hour period
Oracle Enterprise Manager Ops Center deletes the data after six months.
-
Display the Analytics view.
-
Click the Charts tab.
You can create charts 24 hours after you first manage the asset. The asset must be operating and the Enterprise Controller must be able to get access to the asset. You can use the default format or change the charts to use a line, bar, or area format or to use different time intervals.
-
Display the Analytics view.
-
Click the Charts tab.
-
Select an option from the Chart type menu to display the output as a line, bar, or area chart.
-
Select Live, 1 Hour, 1 Day, 5 Days, 3 Weeks, 6 Weeks, or 6 Months from the X Axis (Time) menu to change the time frame for the data.
-
Select Percentage or Unit of Measure to configure the chart's Y Axis.
-
Select the component and options to plot from the Plot selection.
By default, the graphs show one day of data. Select Live in the X Axis menu to change to Live mode, which reports new information every 5 seconds. You can also change the graph to one of the following periods:
-
One hour (1H): One point for every 5 minutes
-
One day (1D): One point for every 5 minutes
-
Five days (5D): One point for every 5 minutes
-
Three weeks (3W): One point every hour
-
Six weeks (6W): One point every 12 hours
-
Six months (6M): One point for every day. To make a graph with the minimum of two points, a system must have been managed for at least 10 minutes to view a one-hour graph and for at least two days to view the six-months graph.
The software stores the data for these time periods separately. For example, when a server is managed for two hours and you select the 6W view, the graph does not display because only one point of data of that type is available; the second point has not yet occurred. When you select the 1D view, the graph displays 24 points of data (120 minutes in 5-minute intervals). However, the graph displays these points over a 24-hour period and not over the actual two-hour period. For the most accurate representation of the data, choose a time period that is less than or equal to the time that the selected server has been managed.
You can export the data for either the current view or all available data to a file in either CSV or XML format. Click Export Chart Data to choose options for exporting the data.
When the graph is blank for a server, one of the following conditions has occurred:
-
Server does not have the appropriate ILOM version.
-
Server has not been discovered through the ILOM driver.
-
Server is unreachable.
12.9.9 Displaying Virtualization Analytics
The Virtualization Analytics view displays resource usage of the physical server for each running operating system instance, showing the physical resources consumed by the control domain (global zone or Oracle VM Server), and each non-global zone or guest. Metrics for Oracle VM Server for x86 are available through the Oracle VM Manager.
-
Virtualization Analytics Summary
-
Virtualization Analytics Zones or Virtualization Analytics Guests
-
Virtualization Analytics History
The information is refreshed every 20 seconds for a guest running on a virtualization server container, including global zones, Oracle VM Server for SPARC, and Oracle VM Server for x86.
12.9.10 Customizing the Analytics View
The default display is the resource usage data. You can change the display settings for each view and choose which system resource graphs and details to display. The changes made on a given analytics page affects the views of all analytics screens for the same OS or virtualized OS.
To Customize the Analytics View
-
Select an operating system (global zone) or zone in the Navigation pane.
-
Click the Analytics tab.
-
Click the Settings Menu icon in the center pane.
-
If you select a global zone that has zone, click the Zones Analytics subtab, then click the Settings Menu icon in the center pane to change the view for the Zones Analytics page.
12.10 Overview of Oracle Solaris Boot Environments
Boot environments are a feature of Oracle Solaris. A boot environment is an instance of a bootable Oracle Solaris image plus additional software packages that are installed onto the image, and the set of all file systems and devices (disk slices and mount points) that are required to operate an Oracle Solaris OS instance. You can have disk slices, also known as partitions, on the same disk or distributed across several disks.
A dual boot environment consists of a live, or active, boot environment (BE) and one or more inactive alternate boot environments (ABE). A system can have only one active boot environment, which is the booted environment. An alternate boot environment is an inactive environment that is not currently booted. A system can have many inactive boot environments. You can activate an alternate boot environment at any time.
You can use a dual boot environment within Oracle Enterprise Manager Ops Center to manage your Oracle Solaris software. A dual boot environment is often used to manage updates because it can significantly reduce the service outage time that is usually associated with patching. Maintaining multiple boot environments also enables quick and easy rollback to a version before the patches were applied, if needed. The boot environment technology enables you to duplicate a boot environment and perform the following tasks without affecting the currently running system:
-
Run an Oracle Solaris software update simulation on the inactive boot environment. You can run the simulation with or without downloading the patches.
-
Update your Oracle Solaris OS on the inactive boot environment and test the update before deploying it as your active environment.
-
Maintain multiple boot environments with different images. For example, you can create one boot environment that contains all current patches and another that contains only security patches.
12.10.1 Understanding the Differences Between Oracle Solaris 11 and Oracle Solaris 10 Boot Environments
The boot environment feature changed beginning with Oracle Solaris 11, including the supported file systems, file system requirements, zone support, and how boot environments are created.
Oracle Solaris 11 Boot Environments use the beadm utility and ZFS file systems to create and manage boot environments. You do not need to create boot environments ahead of time. The software creates them automatically. You can use an agent-managed or agentless-managed operating system with the Oracle Solaris 11 Boot Environments feature.
Oracle Solaris 10 and earlier use the Live Upgrade feature with lucreate scripts and ZFS or UDFS file systems to create alternate boot environments. You must use an agent-managed operating system with the Oracle Solaris Live Upgrade feature.
The Boot Environments profile defines the boot environment for the OS update deployment plans. The Oracle Solaris release determines how the profile is used:
-
Oracle Solaris 11: The profile indicates the policy that is used when an OS update plan is executed. Use this profile to define the creation policies and as a step in an OS update deployment plan.
-
Oracle Solaris 10: The profile defines the
lucreatescript that is used to create your alternate boot environments. Use this profile to specify how to create alternate boot environments for the eligible operating systems in your data center, create alternate boot environments, synchronize and activate boot environments, and as a step in an OS update deployment plan.
The user interface assists you in easily navigating the differences in the boot environments features and provides a unified view whenever possible. See Overview of Oracle Solaris 11 Boot Environments and Overview of Oracle Solaris 10 Boot Environments for detailed version-specific information.
12.10.2 Monitoring Boot Environments
Monitoring rules and thresholds are defined in the Monitoring tab. The following rules apply to boot environments:
-
Number of Boot Environments: Defines the number of boot environments in the selected zone.
-
Boot Env Usage Percent in a ZPool: Defines the percentage disk utilization on the boot environments in any of the zpools.
Each rule has two defined thresholds:
-
Warning: Generates a warning alert and displays the yellow warning badge in the Asset navigation tree. A warning alert contains a suggested action.
-
Critical: Generates a critical alert and displays the red critical badge in the Assets tree. By default, a critical alert contains an automated action.
See Monitoring Operating Systems for more information.
To Clear a Boot Environment Incident
Perform the following steps to manually clear the disk space and close the incident:
-
Click an OS in the Assets tree to view the Boot Environment in the center pane, then click the Incidents tab.
-
Delete one or more boot environments to clear the disk space.
-
Select one or more incidents, then click the Close Incidents icon in the center pane.
See Chapter 4, "Monitoring Rules and Policies" for details on how monitoring rules and policies work in the software and see Chapter 9, "Incidents" for information on how to manage and close an incident.
12.10.3 Viewing Boot Environments
The active boot environment is identified in the Boot Environments tab and in the Summary tab. Inactive boot environments appear in the Boot Environments tab for each operating system. For global zones, the Boot Environments tab displays the relationship between the associated zones and existing boot environments.
Note:
If there are no alternate boot environments, the Boot Environments tab does not appear in the center pane.Boot environment support for Oracle Zones is available beginning with Oracle Solaris 11, enabling boot environments from the non-global zone to appear in the UI. Boot environments for non-global zones appear in the Boot Environment tab, not the Assets tree. Select a non-global zone in the Assets tree, then click the Boot Environments tab in the center pane.
The Summary tab provides the name of the active boot environment, the zpool utilization of all zpools for the selected OS and the amount of zpool utilization attributed to the boot environments. Details are available in the Boot Environments tab.
-
Click an OS or zone in the Assets tree. Details about the active boot environment appear in the Summary tab.
Non-bootable snapshots are available beginning with Oracle Solaris 11. When a boot environment has one or more associated non-bootable snapshots, the snapshots appear in the Snapshots subtab, as shown in Figure 12-15.
Figure 12-15 Boot Environment Tab and Snapshots Subtab
Description of "Figure 12-15 Boot Environment Tab and Snapshots Subtab"
-
Click the Boot Environments tab in the center pane to see details about the associated alternate boot environments.
If the tab is disabled, no alternate boot environments exist for that OS in the zone or non-global zone.
-
To display file system details, click the boot environment in the table, then click the File Systems subtab:
-
Oracle Solaris 11: Mount point information, boot environment file systems, zone boot environment information, and non-global zones in the selected boot environment. When a global zone boot environment is selected, the zone boot environment details are listed separately, a zone per row. You can expand all rows to display a complete view of all zone boot environments under the selected global zone boot environment.
-
Oracle Solaris 10: Mount point information and boot environment file systems.
-
-
To display associated zone boot environment details, click the boot environment in the table, then click the Associated Zone BEs subtab:
-
Oracle Solaris 11: Mount point information, boot environment file systems, zone boot environment information, and non-global zones in the selected boot environment. When a global zone boot environment is selected, the zone boot environment details are listed separately, a zone per row. You can expand all rows to display a complete view of all zone boot environments under the selected global zone boot environment.
-
Oracle Solaris 10: Mount point information and boot environment file systems.
-
Monitoring rules and thresholds are defined in the Monitoring tab.
12.10.4 Managing Boot Environments
You can view all available boot environments for a system, and choose to activate an alternate boot environment or delete inactive environments.
12.10.4.1 Activating and Reboot a Boot Environment
Activating a boot environment makes an inactive or alternate boot environment the active boot environment. You can activate a single boot environment, or you can select an OS group and activate an alternate boot environment for each operating system.
To Activate a Single Boot Environment
Information about boot environments appears in the Boot Environments tab for each operating system.
Perform the following steps to activate a single boot environment:
-
Click an Oracle Solaris 11 global or non-global zone or an Oracle Solaris 10 global zone in the Assets tree.
-
Click the Boot Environments tab.
Existing boot environments for the OS appear in the center pane.
To Activate Boot Environments for All Members of a Group
You can activate an alternate boot environment for all members of a group. If each OS in the group has a single alternate boot environment, all operating systems are booted into the alternate boot environment. When some systems have more than one alternate boot environment, you are prompted to select the alternate boot environment.
Perform the following steps to activate boot environments for all members of an operating system group:
-
Select an Oracle Solaris 11 or an Oracle Solaris 10 Operating system group from the Assets section in the Navigation pane.
-
Click Activate Boot Environment and Reboot in the Actions pane.
-
For systems with multiple alternate boot environments, select the one that you want to boot into. A Filter ABE by name option is available to identify similarly named alternate boot environments across multiple targets.
12.10.4.2 Deleting a Boot Environment
When you delete a boot environment, you delete all associated snapshots and unshared file systems. A snapshot is a non-bootable copy of a boot environment. If there are non-global zone boot environments associated with the global zone boot environment, they are deleted too. Shared file systems are not deleted.
You cannot delete the active boot environment.
-
Click an Oracle Solaris 11 global or non-global zone, or an Oracle Solaris 10 global zone in the Assets tree.
-
Click the Boot Environments tab.
-
Select one or more boot environments or snapshots that you want to remove, then click the Delete icon. Figure 12-16 shows a snapshot selected for deletion.
Figure 12-16 Delete an Oracle Solaris 11 Snapshot
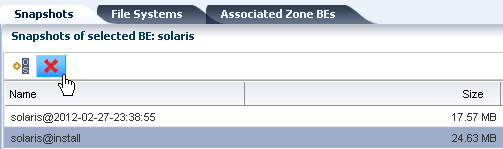
Description of "Figure 12-16 Delete an Oracle Solaris 11 Snapshot"
12.11 Overview of Oracle Solaris 11 Boot Environments
Oracle Solaris 11 uses ZFS file systems, where the swap and dump volumes are shared within the pool. For unshared file systems, ZFS is the only supported file system for boot environments on Oracle Solaris 11. With the ZFS-based boot environment, the boot environments are clones of the existing ZFS partitions. This saves disk space and you do not need to reserve disk partitions for additional boot environments. The create and activate boot environment functionality is much faster than in previous versions.
Oracle Solaris 11 boot environments are managed through the beadm utility. A new boot environment is created whenever the kernel or system packages are installed or updated. This can result in high disk space utilization levels. By default, Oracle Enterprise Manager Ops Center monitors the disk (zpool) utilization of boot environments. If the utilization levels exceed defined thresholds, you can delete unwanted boot environments.
When a boot environment is created in the global zone, the following occurs:
-
A Boot Environment of the source boot environment is created (the boot environment from which it is cloned).
-
The currently active boot environment in all of the non-global zones is cloned and it is associated with the global zone boot environment that was just created.
When a global zone boot environment is activated, the active boot environment data set that is associated with that boot environment in each non-global zone is mounted and activated. Only one non-global zone boot environment that is associated with a global zone boot environment can be active.
When a global zone boot environment is deleted, all corresponding zone-specific boot environments are also deleted.
When a non-global zone is deleted, all corresponding boot environments are deleted. The boot environments for other zones are not deleted.
12.11.1 Displaying Oracle Solaris 11 Boot Environment Details
The Oracle Solaris 11 Boot Environments tab provides you with a large amount of information about the boot environments that are associated with the selected physical or virtual Oracle Solaris 11 operating system. This is particularly valuable since Oracle Solaris 11 boot environments are automatically created and they can quickly consume valuable resources. The following information is available:
-
Displaying Total ZPools Utilization for Oracle Solaris 11 Boot Environments
-
Displaying Snapshots for Oracle Solaris 11 Boot Environments
-
Displaying File Systems for Oracle Solaris 11 Boot Environments
12.11.1.1 Displaying Total ZPools Utilization for Oracle Solaris 11 Boot Environments
The first section in the Boot Environments tab is Total ZPools Utilization. It is compressed by default. Use the arrow to expand the table. The amount of resources used by the zpool appears in this section, as shown in Figure 12-17.
Figure 12-17 Oracle Solaris 11 Total ZPools Utilization
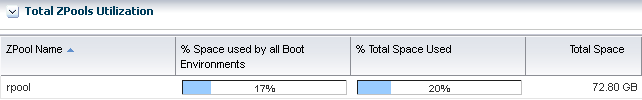
Description of "Figure 12-17 Oracle Solaris 11 Total ZPools Utilization"
12.11.1.2 Displaying Oracle Solaris 11 Boot Environments
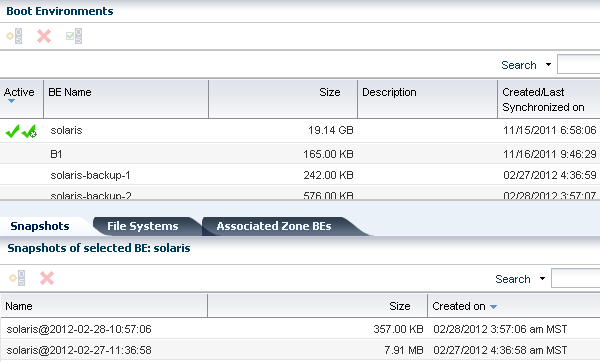
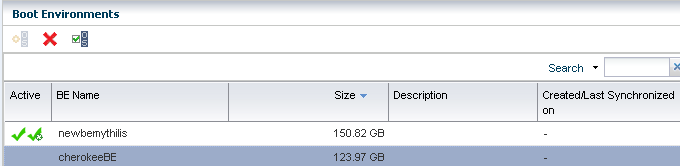
All boot environments that are associated with the physical or virtual operating system that is selected in the Assets tree appear in the Boot Environments table. As shown in Figure 12-18, the active status, size, and when the boot environment was created appear in this section. A green check mark icon next to the boot environment name identifies the boot environment as active. A green check mark with a green circle and white x indicates that this is the boot environment that is active upon reboot. When two green check marks are visible in the Active column, the boot environment is active and is the active boot environment upon reboot.
Figure 12-18 Oracle Solaris 11 Boot Environments Tab
Description of "Figure 12-18 Oracle Solaris 11 Boot Environments Tab"
The lower section of the page has three tabs that provide details about the boot environment that you select in the Boot Environments table.
12.11.1.3 Displaying Snapshots for Oracle Solaris 11 Boot Environments
A snapshot is a point-in-time image of a Volume. It is a non-bootable copy of a boot environment that uses much less disk space than a boot environment. You can create a boot environment from a snapshot.
Non-bootable snapshots are available beginning with Oracle Solaris 11. Select a boot environment in the Boot Environments table to see all associated non-bootable snapshots in the Snapshots tab. You can select a snapshot in this tab and click the icon to create a boot environment from the snapshot.
Figure 12-19 Oracle Solaris 11 Boot Environment Snapshots
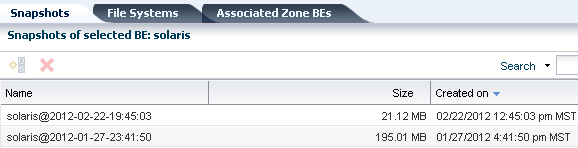
Description of "Figure 12-19 Oracle Solaris 11 Boot Environment Snapshots"
12.11.1.4 Displaying File Systems for Oracle Solaris 11 Boot Environments
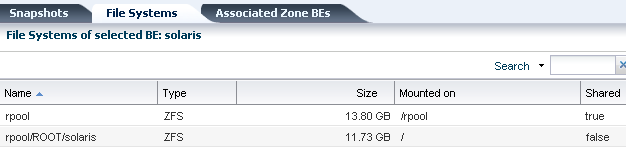
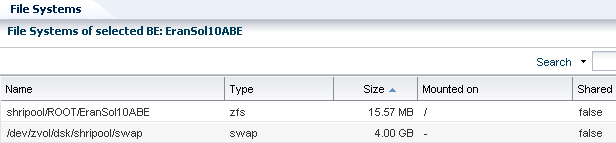
The File Systems tab provides file system details for the boot environment, or alternate boot environment, that you select in the Boot Environments tab. As shown in Figure 12-20, the file system name, type, size and mount location appear in this table. You can also see if the file system is shared or not.
Figure 12-20 Oracle Solaris 11 Boot Environments File Systems
Description of "Figure 12-20 Oracle Solaris 11 Boot Environments File Systems"
12.11.1.5 Displaying Associated Zone Boot Environments
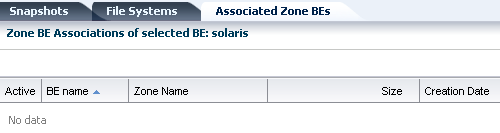
The Associated Zone BEs tab is populated with the boot environment details for a selected zone's boot environment. The zone might have multiple boot environments. The table shows when the boot environment selected is active. As shown in Figure 12-21, you can see the boot environment name, the zone name, the size and when the boot environment was created. When you select an operating system that is not a zone, No Data appears in the table.
Figure 12-21 Oracle Solaris 11 Boot Environments Associated Zone BEs
Description of "Figure 12-21 Oracle Solaris 11 Boot Environments Associated Zone BEs"
12.11.2 About Boot Environment Profiles and Plans for Oracle Solaris 11
A Boot Environments plan and profile for Oracle Solaris 11 operating systems identifies and defines how the boot environment is updated and activated. You can use an agent-managed or agentless-managed operating system.
Use the profile for Oracle Solaris 11 to perform the following tasks:
-
Create a Boot Environments profile that defines the creation policies
-
Create an OS update deployment plan, specifying a Boot Environments profile and an OS update profile
You can create profiles with different policy options. The following options are available for Oracle Solaris 11:
-
Create a new boot environment only when needed, such as when the OS update operation requires a reboot.
-
Always create a new boot environment.
-
Never create a new boot environment.
-
Activate and reboot.
Note:
Oracle Solaris 11 boot environments cannot have spaces in the name. When you name a boot environment, do not use spaces.To Create a Boot Environments Profile for Oracle Solaris 11
-
Click Plan Management in the Navigation pane, then scroll down to the Profiles and Policies directory and click Boot Environments.
The Boot Environments Profiles page appears in the center pane.
-
Click Create Profile in the Actions pane.
-
Enter a unique profile name, without spaces, and provide a description to identify the profile. Select the Oracle Solaris 11 subtype.
-
Choose the boot environment policy for this profile:
-
Create a new boot environment when needed.
-
Always create a new boot environment.
-
Never create a new boot environment.
-
-
Click the check box to activate boot environment and reboot when the job is completed.
-
Choose to have the software automatically create a unique name or enter a specific boot environment name in the field provided, then click Finish.
To Copy an Oracle Solaris 11 Boot Environments Profile
Copying a boot environment profile makes a copy of an existing profile.
-
Click Plan Management in the Navigation pane, then scroll down to the Profiles and Policies directory and click Boot Environments.
The Boot Environments Profiles page appears in the center pane.
-
Select the profile to copy, then click the Copy Profile icon in the center pane.
-
Enter a unique profile name, without spaces, and a description.
-
Change the boot environment parameters, as needed, then click Finish.
12.11.3 Creating an Oracle Solaris 11 Boot Environment
A new alternate boot environment is automatically created when you install or update the operating system's kernel or system packages.
You can create a bootable or non-bootable copy an existing boot environment. A non-bootable copy is call a snapshot. You can create a boot environment from a snapshot.
To Create an Oracle Solaris 11 Boot Environment
You can create a bootable or non-bootable (snapshot) copy of an Oracle Solaris 11 boot environment.
-
Click an Oracle Solaris 11 OS, a global or non-global zone, in the Assets tree, then click the Boot Environments tab.
-
Select the boot environment to copy, then click the Create icon.
-
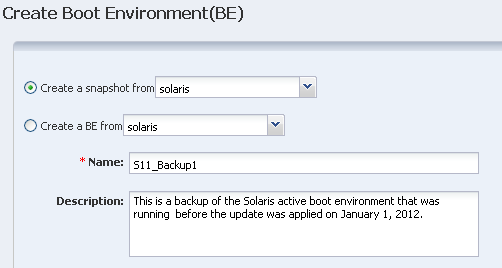
Select either the Create a Snapshot or Create a BE option, then select the boot environment to use as the source. Enter a unique name for the boot environment, without spaces, and provide a description that includes the purpose of the boot environment and the name of the source boot environment. Click Create.
Figure 12-22 Create Boot Environment for Oracle Solaris 11
Description of "Figure 12-22 Create Boot Environment for Oracle Solaris 11"
-
When the job finishes, refresh the Boot Environment table to see the new boot environment.
If you have a group that contains only Oracle Solaris 11 operating systems and you select the OS group as the target, a new boot environment is created for every active boot environment in the group. You can assign a common name for all of the boot environments. If you do not assign a common name, default names are assigned.
12.12 Overview of Oracle Solaris 10 Boot Environments
Boot environments in Oracle Solaris 10 are managed through the Live Upgrade feature. A boot environment is created by using a script that contains the lucreate command and options.
The Live Upgrade feature is available on the following operating systems:
-
Oracle Solaris 10 OS for x86 platform versions through Oracle Solaris 10 5/09: Update alternate boot environments for physical systems.
-
Oracle Solaris 10 OS for SPARC through Oracle Solaris 10 5/09: Update alternate boot environments for physical and virtual machines, including Oracle Solaris Zones and Oracle VM Server for SPARC (formerly known as Logical Domains).
Note:
Do not use Oracle Solaris Live Upgrade on your Enterprise Controller or Proxy Controllers. It does not synchronize all of the files that are required for these Oracle Enterprise Manager Ops Center components.To create and update alternate boot environments, install the latest Oracle Solaris Live Upgrade packages and patches. This ensures that you have all the latest bug fixes and features. In addition, verify that the disk space and format are sufficient for an alternate boot environment.
Live Upgrade packages and patches are available for each Oracle Solaris software release beginning with Oracle Solaris 10 OS. Use the packages and patches that are appropriate for your software instance.
If you installed Oracle Solaris 10 using any of the following software groups, have the required packages:
-
Entire Oracle Solaris Software Group Plus OEM Support
-
Entire Oracle Solaris Software Group
-
Developer Oracle Solaris Software Group
-
End User Oracle Solaris Software Group
When you install one of these Software Groups, verify that you have all of the required packages:
-
Core System Support Software Group
-
Reduced Network Support Software Group
For detailed requirements to install and use the Live Upgrade feature, see Oracle Solaris 10 Installation Guide: Solaris Live Upgrade and Upgrade Planning at http://docs.oracle.com/cd/E18752_01/html/821-1910/preconfig-17.html. For information on other releases, see Operating Systems Documentation at http://docs.oracle.com/en/operating-systems/. Review and verify that all the packages and patches that are relevant to your system are installed and that the disk is formatted properly before creating a new boot environment.
For Oracle Solaris 10 alternate boot environments, file systems are categorized into the following types:
-
Critical File Systems: Non-sharable file systems that are required by the Oracle Solaris OS, such as root (
/),/usr,/var, and/opt. These file systems are separate mount points in thevfstabof the active and inactive boot environments and are always copied from the source to the inactive boot environment. -
Sharable File Systems: User-defined files, such as
/export, that contain the same mount point in thevfstabin both the active and inactive boot environments. Updating shared files in the active boot environment also updates data in the inactive boot environment. When you create a boot environment, sharable file systems are shared by default. If you specify a destination slice, also known as a partition, the file systems are copied. -
Swap: Depends on the type of file system:
-
For UFS file systems, swap is a special sharable volume. Like a sharable file system, all swap slices are shared by default. If you specify a destination directory for swap, the swap slice is copied.
-
For ZFS file systems, swap and dump volumes are shared within the pool.
-
When creating a new boot environment in Oracle Solaris 10, the entire contents of a slice is copied to the designated new boot environment slice. You might want some large file systems on that slice to be shared between boot environments rather than copied to conserve space and copying time. File systems that are critical to the OS such as root (/) and /var must be copied. File systems such as /home are not critical file systems and could be shared between boot environments. Sharable file systems must be user-defined file systems and on separate swap slices on both the active and new boot environments. You can reconfigure the disk several ways, depending your needs.
You can reslice, or partition, the disk before creating the new boot environment and put the sharable file system on its own slice. For example, if the root (/) file systems, /var, and /home are on the same slice, reconfigure the disk and put /home on its own slice. When you create any new boot environments, /home is shared with the new boot environment by default. To share a directory, the directory must be split off to its own slice.
12.12.1 Requirements for Oracle Solaris 10 Live Upgrade and Oracle Solaris Zones
The following requirements are needed to use the Live Upgrade feature with zones:
-
Agent managed operating system
-
At least Oracle Solaris 10 5/09 (update 7) operating system
-
Storage library used to house the zones cannot be part of the root pool; you must create a separate pool on a shared file system
-
You cannot use the
-poption to create alternate boot environments
The -p option, which copies between two root pools on ZFS configuration, is not supported with the lucreate command.
Note:
If you plan to use alternate boot environments with zones, you must designate sufficient zone storage space. When you create the zones and configure the zone storage, specify twice the size of the zone file system for the root file system of the zone. For example if your zone root file system was configured as 8 GB, the storage used to back up the zone must be at least 16 GB.See Updating Zones for how to update Oracle Solaris Zones without using a dual boot environment.
12.12.2 Displaying Boot Environment Details for Oracle Solaris 10
The Oracle Solaris 10 Boot Environments tab provides you with a large amount of information about the boot environments that are associated with the selected Oracle Solaris operating system. A Boot Environments tab is not available for Oracle Solaris 10 non-global zones. The following information is available:
-
Displaying Total ZPools Utilization for Oracle Solaris 10 and Earlier Boot Environments
-
Displaying File Systems for Oracle Solaris 10 and Earlier Boot Environments
12.12.2.1 Displaying Total ZPools Utilization for Oracle Solaris 10 and Earlier Boot Environments
The first section in the Boot Environments tab is Total ZPools Utilization. It is compressed by default, use the arrow to expand the table. The amount of resources used by the zpool appears in this section, as shown in Figure 12-23.
Figure 12-23 Oracle Solaris 10 and Earlier Total ZPools Utilization
Description of "Figure 12-23 Oracle Solaris 10 and Earlier Total ZPools Utilization"
12.12.2.2 Displaying Boot Environments for Oracle Solaris 10 and Earlier
All boot environments that are associated with the physical or virtual operating system that is selected in the Assets tree appear in the Boot Environments table. As shown in Figure 12-24, the active status, size, description, and when the boot environment was created or synchronized appear in this section. A green check mark icon next to the boot environment name identifies the boot environment as active. A green check mark with a green circle and white x indicates that this is the boot environment that is active upon reboot. When you see two green check marks in the Active column, the boot environment is active and is the active boot environment upon reboot.
Figure 12-24 Boot Environments for Oracle Solaris 10 and Earlier
Description of "Figure 12-24 Boot Environments for Oracle Solaris 10 and Earlier"
The lower section of the page the File Systems tab that provide details about the boot environment that you select in the Boot Environments table.
12.12.2.3 Displaying File Systems for Oracle Solaris 10 and Earlier Boot Environments
The File Systems tab provides file system details for the boot environment, or alternate boot environment, that you select in the Boot Environments tab. As shown in Figure 12-25, the file system name, type, size and mount location appear in this table. You can also see if the file system is shared or not.
Figure 12-25 Oracle Solaris 10 Boot Environments File Systems
Description of "Figure 12-25 Oracle Solaris 10 Boot Environments File Systems"
12.12.3 About Boot Environment Profiles and Plans for Oracle Solaris 10 and Earlier
You can use an alternate boot environment that was created outside of Oracle Enterprise Manager Ops Center; however, the preferred method is to create a Boot Environment profile and use the associated plan to create a boot environment. In either case, the operating system must be an agent-managed asset in the Oracle Enterprise Manager Ops Center software.
Use the profile for Oracle Solaris 10 and earlier releases to perform the following tasks:
-
Create a Boot Environments profile to specify how to create boot environments across all your managed system, using
lucreatescripts. -
Create your boot environments using the action in the action panel for your assets. This is typically a one time operation, as you'll probably reuse the alternate boot environment.
-
Create a Boot Environments profile to always sync (and possibly) activate. Use this profile for OS update deployment plans.
-
Create an OS update deployment plan specifying the boot environment in step 3 and any OS update profile.
Depending on the Oracle Solaris version that you are using, several methods are available for creating alternate boot environments. The Oracle Enterprise Manager Ops Center software uses Boot Environments profiles to help standardize and simplify the process.
Perform the following tasks before creating a Boot Environments profile:
12.12.3.1 Determining Your Boot Environment Policy
Each Boot Environments profile can have a different boot environment policy. The following options are available for Oracle Solaris 10:
-
Activate Boot Environment and reboot on job completion.
-
Synchronize existing Boot Environment before submitting a job.
12.12.3.2 Determining Your Live Upgrade Feature Requirements and Options
For Oracle Solaris 10 only, determine the file system and swap requirements and the lucreate command options that you want to use. If you are using ZFS, create a zpool. See Oracle Solaris 10 9/10 Installation Guide: Solaris Live Upgrade and Upgrade Planning available at: http://docs.oracle.com/cd/E18752_01/html/821-1910 for more information about the requirements and command options for the Live Upgrade feature.
You can create an operational plan that includes your script, or you can enter the lucreate options directly in the Boot Environments profile without creating a script.
12.12.3.3 Overview of Boot Environments Profiles and Plans
The following is a high-level overview of how to create an alternate boot environment for Oracle Solaris 10 and earlier releases.
-
Create a Boot Environments profile.
The profile identifies and defines how the boot environment is created and activated, including defining the target type, the options used to create the boot environment, and the activation parameters. Review Oracle Solaris 10 9/10 Installation Guide: Solaris Live Upgrade and Upgrade Planning at: http://docs.oracle.com/cd/E18752_01/html/821-1910 for more details on the requirements:
-
Define your file system and swap requirements.
-
Determine the
lucreatecommand options. You can enter the options in the Boot Environments profile, or you can create an operational profile that contains a script with thelucreatecommand and options. If you are specifying a variable boot environment name in the script passed to the operational profile, make sure the variable is called BEName. When you use BEName as the variable name, the operational plan passes on the BE name entered during plan execution to thelucreatescript. -
Determine your boot environment policies.
-
-
Create a deployment plan.
The Boot Environment deployment plan defines the failure policy and is associated with a single Boot Environments profile. You can add a Boot Environments profile as a task, or step, within a complex deployment plan. See Plan Management for information about complex plans.
-
Execute the deployment plan.
After the deployment plans are created, a user with the appropriate role and privileges can choose from a list of plans to quickly and consistently create an alternate boot environment.
-
Create and deploy an OS Update plan to update the inactive boot environment. See Updating an Oracle Solaris Boot Environment for the steps to create and deploy the OS Update plan.
For information about system administration tasks such as managing file systems, mounting, booting, and managing swap space, see the Oracle Solaris System Administration Guide: Devices and File Systems in the Oracle Solaris 10 Documentation Library.
12.12.4 Creating an Oracle Solaris 10 Boot Environment
Oracle Solaris Live Upgrade scripts are used to create an alternate boot environment. To create a replica of your boot environment, run the script in Oracle Enterprise Manager Ops Center.
The following methods are available to create the alternate boot environment:
-
Copy an existing boot environment.
-
Execute a Boot Environments deployment plan.
The deployment plan must reference an Boot Environments profile.
-
Run an operational plan that contains the
lucreatescript. -
Upload an Oracle Solaris Live Upgrade script as Local Content in Enterprise Manager Ops Center.
-
Run an OS update job and specify a pre-action which runs the script. You can select multiple compatible targets and create an alternate boot environment for each target using the same script at the same time.
-
Create an OS profile, and then run an OS Update job. The profile enables you to define the components and the actions to be performed every time you use the profile to create an alternate boot environment.
-
-
Run an Oracle Solaris Live Upgrade script from the command-line interface. With this method, you must log in to each agent and then run the script to create the boot environment.
When you create the alternate boot environment with an OS Update job, you can choose to run the job immediately, or you can schedule the job to run during your maintenance window. In all methods, the new boot environment is automatically discovered and a new Boot Environments tab appears in the center pane for OS management.
This task describes how to run a New OS Update job to create the alternate boot environment. Although it is a New OS Update job, the sole purpose of the job is to create an alternate boot environment. The job uses the Live Upgrade script that you uploaded to Local Content to create a duplicate of your boot environment.
12.12.4.1 Defining Deployment Options for Oracle Solaris 10
To create boot environments for Oracle Solaris 10, you can define the options in an Boot Environments profile or you can add a script to an operational profile. The software enables you to store the scripts and parameters and provides a couple of methods of deploying the scripts.
-
As a profile
-
As part of a plan
-
As part of an update job
The scripts use the lucreate command to create an alternate boot environment. For a complete list of options, see the Oracle Solaris 10 lucreate(1M) documentation at http://docs.oracle.com/cd/E19253-01/816-5166/lucreate-1m/index.html. The following are some commonly used options:
-
-moption to create a boot environment and split a directory off to its own slice.To share a directory, the directory must be split off to its own slice. The directory is then a file system that can be shared with another boot environment. You can use the
lucreatecommand with the-moption to create a boot environment and split a directory off to its own slice. But, the new file system cannot yet be shared with the original boot environment. You must run thelucreatecommand with the-moption again to create another boot environment. The two new boot environments can then share the directory. -
-soption to force a synchronization. -
-pspecifies the ZFS pool in which a new boot environment resides.The
-pis not required when the source and target boot environments are within the same pool. The-poption does not support the splitting and merging of file systems in a target boot environment, instead use the-moption.
Existing boot environments appear in the hierarchy in the Boot Environments tab for a global zone. You can create the boot environment with Oracle Enterprise Manager Ops Center or outside of the software.
12.12.4.2 Creating an Oracle Solaris 10 Boot Environment From a Deployment Plan
You can only create a boot environment from a global zone in Oracle Solaris 10. The boot environments on Oracle Solaris non-global zones are tightly coupled with the corresponding boot environment on the global zone and cannot be managed independently.
You can use either of the following deployment plans to create an Oracle Solaris 10 boot environment:
-
Boot Environment: A simple deployment plan that only creates an alternate boot environment. Use the default alternate boot environment profile and then override the applicable parameters to create a boot environment.
-
Software Deployment / Update: A multi-step plan where one of the steps creates a boot environment. See the Oracle Enterprise Manager Ops Center Updating Your Oracle Solaris 10 Operating System for an example of how to use this plan.
Perform the following steps to create a boot environment using the Alternate Boot Environment profile and Boot Environment deployment plan:
-
Click an Oracle Solaris 10 OS global zone in the Assets tree to view the Boot Environment in the center pane.
-
Click the Boot Environment tab.
Existing boot environments for the OS appear in the center pane.
-
To create a copy, or clone, of the existing active boot environment, click the Create icon.
-
Enter a unique name for the boot environment and provide a description. The text describes what the boot environment and from what source it was created. Edit the applicable parameters in the Alternate Boot Environment profile, then click Confirm.
-
When the job finishes, refresh the Boot Environment table to see the new boot environment.
12.12.4.3 Creating an Oracle Solaris 10 Boot Environment from an Operational Plan
An operational profile contains a single script and can define variables. The associated plan launches the profile. An operational plan is associated with a specific version of an operational profile. By default, creating a profile also creates an operational plan.
You can create the boot environments using this script from a few different contexts:
-
Simple BE Operational profile
-
Boot Environments profile using BE Operational profile from the plan context
-
Create Boot Environment from the asset context
You can save a shell script on the Enterprise Controller and download it into the plan, or you can enter the script in a field when you create the plan. Both types of shell scripts are executed by the user. They differ in the location, either on the Enterprise Controller or on the remote Agent Controller, and the user credentials needed to execute the profile. See Operational Plans and Profiles for more information about operational profiles and plans and the variables you can use.
-
Click Plan Management in the Navigation pane, then click Operational Profiles. The Operational Profiles appear in the center pane.
-
Click Create Operational Profile. The Create Profile - Operation page appears.
-
Enter a name for the new plan and a description of its purpose or role.
-
Select an asset type from the Subtype list.
-
Click Next.
-
Select the Operation Type from the drop-down menu, either EC Shell or Remote Shell.
-
If you select EC Shell, browse to the location of the script in the Script File field, then click Load Script.
-
If you select Remote Shell, enter your script in the Script field.
-
-
Enter a numeric value in the Timeout field, then select Minutes or Seconds. The default timeout is 60 minutes.
-
(Optional) Click View System Variables to view the default variables.
-
Click Next.
-
(Optional) Specify Additional Variables. You can specify any variable you want. For example, add Alarm_ID$ to add the incident identifier number for easier incident management.
12.12.4.4 Creating an Update Profile for Oracle Solaris 10 Boot Environment
You can use an Update profile to create and update a boot environment.
-
Expand Plan Management, then click Update Profiles in the Navigation pane.
-
Click New Profile in the Actions pane.
-
Enter a name and description for the profile.
-
Select Script from the Type drop-down menu.
-
Select an OS channel from the Distribution drop-down menu.
-
Select Local from the Category drop-down menu.
-
Choose the options that you want from the View and the Version drop-down menus.
-
Highlight Local RPMs in the Available Packages / Patches table, select the Apply to all applicable distributions check box.
-
Click Profile Contents and select an item, then click Create OS Update Profile.
12.12.4.5 Creating an Oracle Solaris 10 Boot Environment From an Update Profile
You can use an Update profile to create and update a boot environment.
-
Click an Oracle Solaris 10 OS global zone in the Assets tree to view the Boot Environment in the center pane.
-
Click the Boot Environment tab.
Existing boot environments for the OS appear in the center pane.
-
To create a copy, or clone, of the existing active boot environment, click the Create icon.
The plan for execution that uses the default Boot Environments profile for Oracle Solaris 10 appears.
-
Enter a unique name for the boot environment and provide a description. The text describes what the boot environment and from what source it was created. Edit the applicable parameters in the Alternate Boot Environment profile, then click Confirm.
-
When the job finishes, refresh the Boot Environment table to see the new boot environment.
12.12.4.6 Creating an Oracle Solaris 10 Boot Environment With an OS Update Job
Oracle Solaris Live Upgrade contains a suite of script commands. To create an alternate boot environment with Enterprise Manager Ops Center, use the lucreate command to write one or more Oracle Solaris Live Upgrade scripts, add the scripts to the Local Content library in Enterprise Manager Ops Center, then run an OS Update job and select the ABE options.
When you use Enterprise Manager Ops Center to create the alternate boot environment, the scripts must meet the following requirements:
-
The script cannot contain parameters.
-
The alternate boot environment name must be hard-coded into the script itself or otherwise be provided outside of Enterprise Manager Ops Center.
-
The alternate boot environment name defined in the script must match the alternate boot environment name that you use when you run the update job to create the alternate boot environment.
-
The script must return 0 on success and non-zero on failure.
For detailed instructions and examples for using the lucreate command to create a boot environment, see Oracle Solaris 10 9/10 Installation Guide: Solaris Live Upgrade and Upgrade Planning available at: http://docs.oracle.com/cd/E18752_01/html/821-1910.
-
Expand Libraries in the Navigation pane.
-
Click Local Content in the Solaris/Linux OS Updates library.
-
Click Upload Local Action in the Actions pane.
-
Enter a name for the file.
-
Enter a brief description of the purpose of the action.
-
In the Action list, click the Pre-action type of action to run the script on the managed host before job tasks are carried out.
-
Click the name of the distribution that uses the action in the Distribution list. The Parent field shows the category, based on the type of Action.
-
Click Browse to locate and select the file.
-
Click Upload to upload the file to the selected distribution.
To Create a Boot Environment With an OS Update Job
-
Click New Update OS Job in the Update section of the Actions pane. The New Update OS Job Wizard appears.
-
Complete the following Job Information parameters:
-
Enter a job name.
-
Select Actual Run, which creates the alternate boot environment when you specify in Step 5.
-
Select the Sequential task execution order.
-
Select the Target Setting: Use the same Targets for all tasks in the job.
-
Select a Task Failure Policy:
-
Complete as much of the job as possible
-
Stop at failure and notify
-
-
Select the Boot Environment Type check box.
-
Select the Run ABE Pre-action Script check box.
-
-
(Optional) To add tasks to the job, click the Add Task icon. To edit, click the Profile and Policy fields. Click Next.
-
Enter the name of the alternate boot environment, as defined in the script. Select a script, then click Next.
-
(Optional) Complete the Boot Environment Workflow, then click Next.
-
To synchronize the alternate boot environment with the current boot environment before mounting the alternate boot environment, select the Sync ABE check box.
-
To edit the description to describe the state of the Boot Environment, click Modify Current BE, and enter text in the Description field.
-
To edit the description to describe the state of the alternate boot environment, click Modify Alternate BE, and enter text in the Description field.
-
To switch boot environments after update, select the Activate and Reboot ABE check box.
-
-
Schedule the job, then click Next.
-
Run Now: Starts the job immediately after you click Finish in the Job Summary.
-
Start Date: Select a date and time to start the job.
-
On a recurring schedule: Enables you to run the same job on a monthly or daily scheduled time.
-
-
Review the Job Summary, then click Finish to run the job as scheduled in the previous step.
When the job completes, the new alternate boot environment is associated with the operating system. To verify that the alternate boot environment is created, click the operating system in the Assets pane. The Boot Environments tab appears in the center pane. Click the Boot Environments tab to display the new boot environment, as specified in the Live Upgrade script. An OS can have several associated alternate boot environments.
Note:
The Boot Environments tab only appears when at least one alternate boot environment associated with the operating system.12.12.5 Synchronizing Oracle Solaris 10 Boot Environments
You can synchronize, or sync, an active Oracle Solaris 10 global zone boot environment with an inactive boot environment on the same system. Synchronizing boot environments makes the inactive boot environment the same as the currently running boot environment. After you sync the boot environments, you can activate the inactive, or alternate, boot environment.
12.12.6 Activating a Boot Environment
Activating a boot environment switches a new boot environment to become the currently running boot environment when the system reboots.
-
Click an Oracle Solaris 10 OS global zone in the Assets tree to view the Boot Environment in the center pane.
-
Click the Boot Environment tab.
Existing boot environments for the operating system appear in the center pane.
-
Click Activate Boot Environment and Reboot in the Actions pane.
-
To schedule the activation for a later date or time, select the check box. Click Next.
-
If you selected the schedule option, complete the schedule, then click Next.
-
Review the Summary, then click Finish.
The new boot environment activates when you reboot the system.
12.13 Related Resources for Operating System Management
For instructions in performing actions or to learn more about the role of this feature, go to one of the following resources.
-
For end-to-end examples, see the workflows and how to documentation in the Deploy How To library at http://docs.oracle.com/cd/E40871_01/nav/deployhowto.htm and the Operate How To library at http://docs.oracle.com/cd/E40871_01/nav/operatehowto.htm.
-
See Chapter 14, "Operating System Updates" for information about patching, or updating, your operating systems.
-
See Chapter 18, "Oracle Solaris Zones" for information about zones and how you can use Oracle Enterprise Manager Ops Center to efficiently manage all phases of zones lifecycle.
-
See Chapter 4, "Monitoring Rules and Policies" for information on how monitoring rules and policies work in the software.
For in-depth information about these products, see the following Oracle documentation:
-
For a list of the Oracle Linux documentation available in HTML and PDF formats, visit the Oracle Linux Documentation website at http://www.oracle.com/us/technologies/linux/index.html.
-
For a list of the Oracle Solaris 11 documentation available in HTML and PDF formats, visit the Oracle Solaris 11 Documentation website at http://www.oracle.com/technetwork/documentation/solaris-11-192991.html.
-
For a list of the Oracle Solaris 10 documentation available in HTML and PDF formats, visit the Oracle Solaris 10 Documentation website at http://www.oracle.com/technetwork/documentation/solaris-10-192992.html.
-
For a list of the Oracle Solaris 8 and 9 documentation, visit the Legacy Solaris Documentation website at http://www.oracle.com/technetwork/documentation/legacy-solaris-192993.html.
-
For detailed instructions and examples for using the
lucreatecommand to create a boot environment, see Oracle Solaris 10 9/10 Installation Guide: Solaris Live Upgrade and Upgrade Planning available at: http://docs.oracle.com/cd/E18752_01/html/821-1910 and the Oracle Solaris 10 lucreate(1M) documentation at http://docs.oracle.com/cd/E19253-01/816-5166/lucreate-1m/index.html. -
For more information about JET resources and documentation, see Solaris 10 10/09 Installation Guide: Custom JumpStart and Advanced Installations available at http://docs.oracle.com/cd/E18752_01/html/821-1911/index.html.
-
For JET documentation and to download additional modules, see http://www.oracle.com/technetwork/systems/jet-toolkit/index.html.