Creating Multidimensional Models Using Data Manager
This section provides an overview of creating multidimensional models using Data Manager and lists the page to run Data Manager.
Understanding Multidimensional Models Using Data Manager
Although you may have used single-dimensional assignments in your model to preserve cause-and-effect relationships, the Data Manager engine can help you enrich and convert data into a multidimensional format for further analysis. It takes direct costs, indirect costs, and revenue, and calculates data across multiple dimensions—product, customer, channel, and department.
Determining whether to use single-dimensional costing or multidimensional costing requires a precise definition of the business case that you want to address. You must know what questions you want answered. For example, if your organization manufactures beverages, such as coffee and tea, you can use Activity-Based Management to calculate a model based on single-dimensional costing. The output of Activity-Based Management single-dimensional analysis might look something like this:
|
Cost Object |
Type |
Cost in USD |
Units |
Cost per Unit in USD |
|---|---|---|---|---|
|
Southwest Company |
Customer |
400 |
n/a |
n/a |
|
Central Company |
Customer |
600 |
n/a |
n/a |
|
New Northern Company |
Customer |
400 |
n/a |
n/a |
|
Tea |
Product |
600 |
60 |
10/case |
|
Coffee |
Product |
900 |
120 |
7.50/case |
With single-dimensional output and information, answers to these questions come easily:
How much does it cost to make four cases of tea?
How much is the unit cost of a case of coffee?
How much does it cost to serve all of our customers?
How much money could be saved by not doing business with the Central Company?
However, these types of questions are impossible to answer using this single-dimensional output:
Which customer is the most or least profitable?
Which product is the most or least profitable?
Which mix of products is the most or least profitable?
Clearly, more information is required to answer these questions. You need information regarding the revenue from each of the products as well as information regarding the products that each of the customers purchased. Such information could be obtained from your billing system as the following table represents:
|
Customer |
Product |
Quantity |
Revenue in USD per Case |
Total Revenue in USD |
|---|---|---|---|---|
|
Southwest Company |
Coffee |
50 |
10 |
500 |
|
Central Company |
Coffee |
30 |
10 |
300 |
|
New Northern Company |
Coffee |
40 |
10 |
400 |
|
Southwest Company |
Tea |
10 |
15 |
150 |
|
Central Company |
Tea |
20 |
15 |
300 |
|
New Northern Company |
Tea |
30 |
15 |
450 |
The data in this example provides information regarding the number of product cases purchased by a customer and the revenues associated with these product cases. You can use the quantities purchased as the basis for assigning the single-dimensional costs.
After you obtain billing information, use that information in conjunction with the single-dimensional information and use both as input for Data Manager. Data Manager lets you integrate the product and customer dimensions effectively. The following table lists an example of possible Data Manager output with all amounts in USD:
|
Revenues |
Product |
Southwest Company |
Central Company |
New Northern Company |
Total |
|---|---|---|---|---|---|
|
Coffee |
500 |
300 |
400 |
1,200 |
|
|
Tea |
150 |
300 |
450 |
900 |
|
|
Total |
650 |
600 |
850 |
2,100 |
|
|
Cost of Sales |
|||||
|
Coffee |
375 |
225 |
300 |
900 |
|
|
Tea |
100 |
200 |
300 |
600 |
|
|
Total |
475 |
425 |
600 |
1,500 |
|
|
Gross Profit |
175 |
175 |
250 |
600 |
|
|
Customer Costs |
400 |
600 |
400 |
1,400 |
|
|
Net income (or loss) |
(225) |
(425) |
(250) |
(800) |
The results of this analysis show that the Central Company is the least profitable customer.
Image: Data flow to Data Manager
The following flow chart illustrates how Activity-Based Management and Data Manager use direct and indirect costs and revenue.
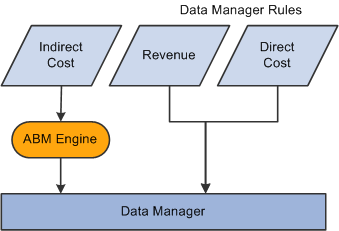
After the system processes data through Data Manager, it is stored in the PF Journal table (PF_JOURNAL_F00).
Note: The Calculation Detail fact table (CALC_DETAIL_F00) and the Calculation Objects fact table (CALC_OBJ_F00) describe the same set of data in different ways. Be careful not to process data redundantly using Data Manager. You should take an either-or approach when determining which tables to use when you are assigning costs using Data Manager.