Defining Data Manager Rules
This topic provides an overview of Data Manager rule methods, lists prerequisites, and discusses how to:
Define a Data Manager rule.
Define sources.
Define the target.
Review and define the source 1 and source 2 columns.
Review the mapped common dimensions.
Review the generated SQL.
Pages Used to Set Up Data Manager Rules
|
Page Name |
Definition Name |
Navigation |
Usage |
|---|---|---|---|
|
Data Manager Rules - Define Rule |
MD_RULE_TBL1 |
|
Define a data manager rule, including the method you intend to use. |
|
Data Manager Rules - Copy Rule |
MD_RULE_COPY |
Click on the Save As button on the Define Rule page. |
Copy a Data Manager rule and save it under a new rule name. |
|
Data Manager Rules - Define Source 1 |
MD_RULE_SCR1 |
|
Define source 1 information. |
|
Data Manager Rules - Define Source 2 |
MD_RULE_SCR2 |
|
Define source 2 information. |
|
Data Manager Rules - Define Target |
MD_RULE_TBL3 |
|
Define the target for the rule and the target mapping. |
|
Data Manager Rules - DataSet for Source 1 |
MD_DATASET1_DEFN |
|
Review and define the source 1 fields and measures that are mapped to target fields. |
|
Data Manager Rules - DataSet for Source 2 |
MD_DATASET2_DEFN |
|
Review and define the source 2 fields and measures that are mapped to target fields. This page displays the prorata and spread even methods only. |
|
Data Manager Rules - DataSet for Common Dimensions |
MD_DATASET3_DEFN |
|
Review the mapped common dimensions and prorata measure. |
|
Data Manager Rules - SQL |
MD_RULE_TBL4 |
|
Review the generated SQL for the Data Manager rule. |
Understanding Data Manager Rules and Methods
Data Manager rules use metadata to specify the source and the target tables for moving, aggregating, or creating multidimensional engine output.
Most rules have two sources: the measure to be assigned (for example Activity-Based Management indirect costs, revenue amounts, or inventory quantities) and the basis for the assignment (for example, per cent sales by region, product, or channel). Another datamap is selected as the target of the rule.
Data Manager rules define three things: source tables, targets, and the method that you want to apply to the data from the source tables as it moves to the target. These methods are:
Copy method.
Arithmetic method.
GL Mapper method.
Spread even method.
Prorata method.
Tree aggregation method.
Copy Method
The copy method moves data from the source to the target, but does nothing to the data. You would typically use multidimensional data as the source.
An example of this method would be the copy of REVENUE_F00, which is already attributed to the customer, product, and channel dimensions, to PF_JRNL_F00. In this move, no spreading of the revenue amount from the source to the target occurs.
In addition, this example shows that you can also use the copy method to generate aggregate amounts since more than one row of data might exist in source 1 for a customer/product/channel intersection. The copy method allows this type of aggregation by using the sum column on the Define Target page.
Source 1 datamap definition:
DIMs: CUST_ID, PRODUCT_ID, CHANNEL_ID
MSR: MONETARY_AMOUNT
Define Target page:
Target fields of CUST_ID, PRODUCT_ID, CHANNEL_ID mapped to corresponding source 1 fields
Sum check box selected for MONETARY_AMOUNT and mapped to source 1
Source 1 data:
|
Row |
CUST_ID |
PRODUCT_ID |
CHANNEL_ID |
MONETARY_AMOUNT |
|---|---|---|---|---|
|
1 |
CU1111 |
PR111 |
CH11 |
1000.00 |
|
2 |
CU1111 |
PR111 |
CH22 |
2000.00 |
|
3 |
CU1111 |
PR222 |
CH11 |
1000.00 |
|
4 |
CU1111 |
PR222 |
CH11 |
2000.00 |
|
5 |
CU1111 |
PR222 |
CH22 |
3000.00 |
|
6 |
CU2222 |
PR111 |
CH11 |
1000.00 |
|
7 |
CU2222 |
PR111 |
CH22 |
3000.00 |
|
8 |
CU2222 |
PR222 |
CH11 |
3000.00 |
|
9 |
CU2222 |
PR111 |
CH22 |
1000.00 |
Target results:
|
Row |
CUST_ID |
PRODUCT_ID |
CHANNEL_ID |
MONETARY_AMOUNT |
|---|---|---|---|---|
|
1 |
CU1111 |
PR111 |
CH11 |
1000.00 |
|
2 |
CU1111 |
PR111 |
CH22 |
2000.00 |
|
3 |
CU1111 |
PR222 |
CH11 |
3000.00 (Aggregated) |
|
4 |
CU1111 |
PR222 |
CH22 |
3000.00 |
|
5 |
CU2222 |
PR111 |
CH11 |
1000.00 |
|
6 |
CU2222 |
PR111 |
CH22 |
4000.00 (Aggregated) |
|
7 |
CU2222 |
PR222 |
CH11 |
3000.00 |
Arithmetic Method
The arithmetic method applies an arithmetic operation (for example, add, subtract, multiply, or divide) to combine amounts in the sources that are grouped by common dimensions and source (or basis) mapped dimensions.
GL Mapper Method
The GL Mapper takes data from the general ledger tables and maps it to performance data. It populates the temporary table GLSTG. From GLSTG, you can use the copy method to move data directly to the performance journal or apply other methods to enrich your data.
For example, let's say that source 1 looks like this:
|
warehouse business unit |
Account |
Customer |
Amount |
|---|---|---|---|
|
CORP1 |
110 |
C1 |
1500 USD |
|
CORP1 |
111 |
C1 |
1500 USD |
|
CORP1 |
110 |
C2 |
1000 USD |
|
CORP1 |
111 |
C2 |
1000 USD |
If you map 100 percent of the amounts from source accounts 110 and 111 to performance account 100000, the target would look like this:
|
warehouse business unit |
Account |
Customer |
Amount |
|---|---|---|---|
|
CORP1 |
100000 |
C1 |
3000 USD |
|
CORP1 |
100000 |
C2 |
2000 USD |
Spread Even Method
The spread even method adds a dimension to your data, and spreads the fact amount evenly across the dimension. For example, you have revenue for three products as follows:
Source 1:
|
Product |
Amount |
|---|---|
|
P1 |
3000 USD |
|
P2 |
2000 USD |
|
P3 |
1000 USD |
Source 2:
|
Customer |
|---|
|
C1 |
|
C2 |
The target looks like this:
|
Product |
Customer |
Amount |
|---|---|---|
|
P1 |
C1 |
1500 USD |
|
P1 |
C2 |
1500 USD |
|
P2 |
C1 |
1000 USD |
|
P2 |
C2 |
1000 USD |
|
P3 |
C1 |
500 USD |
|
P3 |
C2 |
500 USD |
The amounts for product are spread evenly across the customers.
Prorata
The prorata method adds an additional dimension to your data and divides the amount across that dimension based on the percentage of the total amount. For example, you have revenue for three products as follows:
Source 1:
|
Product |
Amount |
|---|---|
|
P1 |
3000 USD |
|
P2 |
2000 USD |
|
P3 |
1000 USD |
You also want to attribute that revenue to customers. The revenue by customers is:
Source 2:
|
Customer |
Amount |
|---|---|
|
C1 |
4000 USD |
|
C2 |
2000 USD |
The target looks like this:
|
Product |
Customer |
Amount |
|---|---|---|
|
P1 |
C1 |
2000 USD |
|
P1 |
C2 |
1000 USD |
|
P2 |
C1 |
1333.33 USD |
|
P2 |
C2 |
666.67 USD |
|
P3 |
C1 |
666.67 USD |
|
P3 |
C2 |
333.33 USD |
The amounts for the products are prorated based on the percentage of total for each customer (C1 has two-thirds, or 66.67 percent, and C2 has one-third or 33.33 percent).
Tree Aggregation
In the tree aggregation method, measures are aggregated based on a tree hierarchy. The node names act as the dimension. For example, assume you have the following data for individual customer IDs.
Source 1:
|
Customer |
Product |
Channel |
Amount |
|---|---|---|---|
|
C1 |
P1 |
CH1 |
1000 |
|
C1 |
P1 |
CH1 |
1000 |
|
C1 |
P2 |
CH2 |
2000 |
|
C2 |
P1 |
CH1 |
1000 |
|
C2 |
P2 |
CH2 |
2000 |
|
C3 |
P2 |
CH2 |
2000 |
|
C4 |
P1 |
CH1 |
1000 |
|
C4 |
P2 |
CH2 |
2000 |
|
C4 |
P2 |
CH2 |
2000 |
Assume you have the following customer location tree structure.
Source 2:
Image: Sample customer tree
This diagram illustrates an example of a customer tree.
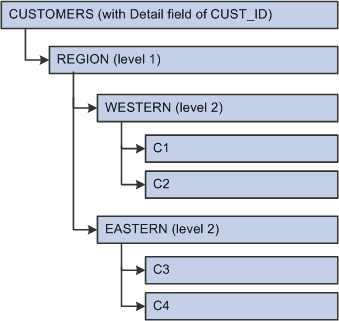
The system rolls up the source data (customer IDs) to the next level up (regions) summarizes it, and reduces the number of rows. In the target table, the customer ID is now the tree node at the desired roll-up level.
This is how the target looks:
|
Customer |
Product |
Channel |
Amount |
|---|---|---|---|
|
WESTERN |
P1 |
CH1 |
3000 |
|
WESTERN |
P2 |
CH2 |
4000 |
|
EASTERN |
P1 |
CH1 |
1000 |
|
EASTERN |
P2 |
CH2 |
6000 |
Prerequisites
Before setting up your Data Manager rules, you must:
Complete set up of your metadata (tablemaps, datamaps, and constraints).
Define any value objects on the Value Object page.
Data Manager Rules - Define Rule Page
Use the Data Manager Rules - Define Rule page (MD_RULE_TBL1) to define a data manager rule, including the method you intend to use.
Image: Define Rule page
This example illustrates the fields and controls on the Define Rule page. You can find definitions for the fields and controls later on this page.
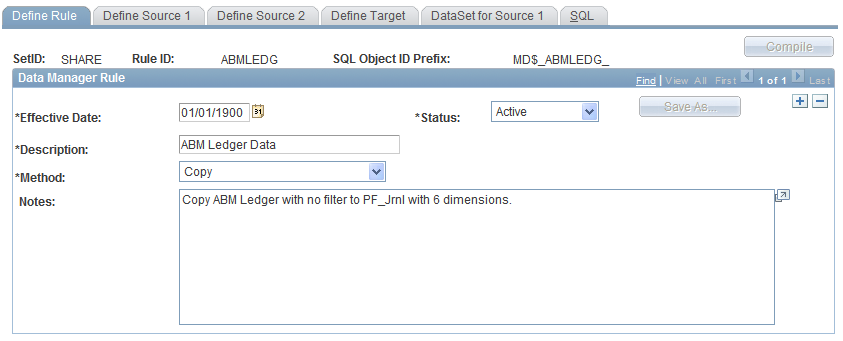
| Method |
Select the method for the rule you are defining. Options are: Arithmetic, Copy, GL Mapper, Prorata, Spread Even, and Tree Aggregation. See Understanding Data Manager Rules and Methods. Note: If the method is changed after the target fields have been populated, some fields might be reset to blank. This occurs if the current method has a source 2 and the new method does not. All source 2 fields that were mapped in the Data Manager Rules component are reset. The system displays a warning message. For a method of Arithmetic, select the operation to use: Addition (+), Division (/), Multiplication (*), and Subtraction (–). For a method of Prorata, the system prorates measures in source 1 across all common dimensions based on source 2 numbers. For a method of Spread Even, the system spreads source 1 measures evenly across all common dimensions based on source 2 numbers. For a method of Tree Aggregation, the system copies data elements from the source to the target based on the source 2 tree structures. |
| Save As |
In correction mode, click the Save As button to access the Copy Rule page on which you can enter a new rule ID to which you want to copy the rule information. Enter an effective date as today's date. Click OK to save the changes and return to the Define Rule page. |
 |
Click the Compilebutton on this page or other pages in the component to build the Data Manager rule. Review the generated SQL on the Data Manager Rules - SQL page. |
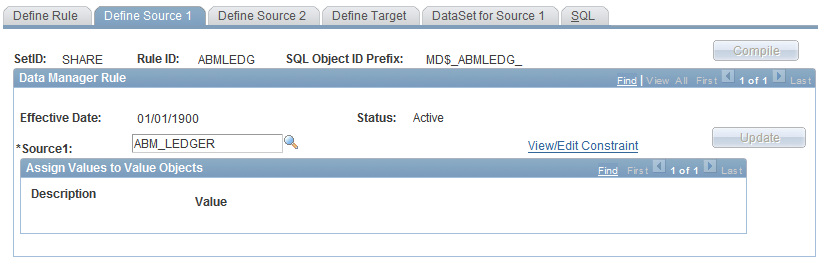
Data Manager Rules - Define Source 1 Page
Use the Data Manager Rules - Define Source 1 page (MD_RULE_SCR1) to define source 1 information.
Image: Define Source 1 page
This example illustrates the fields and controls on the Define Source 1 page.
Use the Data Manager Rules - Define Source 2 page (MD_RULE_SCR2) to define source 2 information.
Image: Define Source 2 page
This example illustrates the fields and controls on the Define Source 2 page.
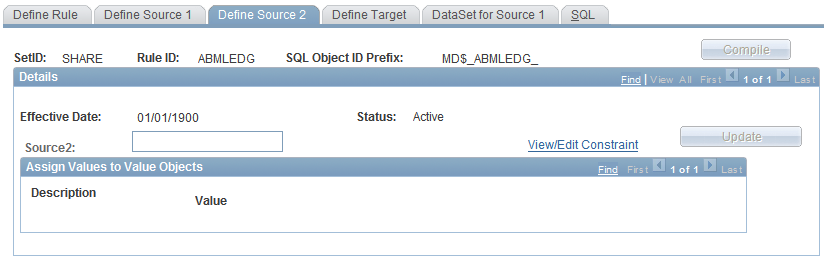
Note: If you change a source constraint after the populating the target fields, the target fields that were mapped to source fields will not be lost so long as the datamap is the same.
Data Manager Rules - Define Target Page
Use the Data Manager Rules - Define Target page (MD_RULE_TBL3) to define the target for the rule and the target mapping.
Image: Define Target page
This example illustrates the fields and controls on the Define Target page. You can find definitions for the fields and controls later on this page.
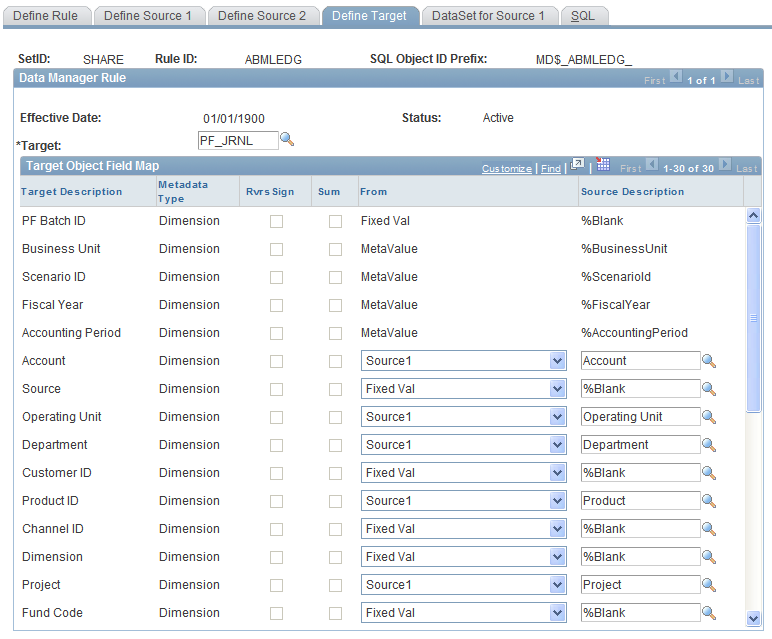
Target Definition for the Copy Method
When you are setting up the target field map for the copy method:
If you select a target measure field that is mapped to a source 1 field for a sum operation, all other measures that are mapped to source 1 fields must also be selected for a sum operation.
If you select the sum check box for any of the fields, you can map only key source 1 fields.
If you do not select the sum check box for any of the fields, you can map any source 1 fields to any target fields.
This might result in duplicate data when you run the Data Manager engine. This is because you are not grouping the data by the key values.
You can use expressions for your mappings.
Target Definition for the Prorata Method
When you are setting up the target field map for the prorata method:
Only three mapped measures are allowed.
The source 1 and source 2 datamaps must both have at least one key field that is marked as a dimension.
All non-measure target fields can be mapped only to source 1 or source 2 fields that are marked as dimensions (keys) on the datamap.
All measure target fields can only be mapped to source 1, fixed value, or meta value fields.
At least one measure target field must be marked for prorata.
If a target field is mapped to a source 1 field, it must be marked for prorata.
Target Definition for the Spread Even Method
When you are setting up the target field map for the spread even method:
Only three mapped measures are allowed.
The source 1 and source 2 datamaps must both have at least one key field that is marked as a dimension.
All non-measure target fields can only be mapped to source 1 or source 2 fields that are marked as dimensions (keys) on the datamap.
All measure target fields can only be mapped to source 1, fixed value, or meta value fields.
Data Manager uses all the source 1 mappings for the spread even calculation.
At least one measure target field must be mapped to a source 1 field.
Target Definition for Tree Aggregation Method
When you are setting up the target field map for the tree aggregation method:
Each target field must have a source 1 field, tree node, or value object to which it is mapped.
Only one target field can be mapped to the source 2 tree node.
This tree node field is used in conjunction with the source 1 mapping field for join criteria in the SQL.
You must have at least one non-measure target field mapped to source 1.
If the target field is mapped to source 2, you can select from all the fields for that source.
If a target field is mapped to source 2, the only selection available is Tree Node.
Defining Foreign Currency
You must always provide values for the Foreign Currency Code in the target definition. Even if you are using United States dollars as your base currency, you must populate the Foreign Currency Code in the target definition. For example, if you use United States dollars as your base currency, you must map Source1 to Base Currency Code (as the following graphic demonstrates).
Image: Define Target page - Foreign Currency Code field
This example illustrates the fields and controls on the Define Target page - Foreign Currency Code field.
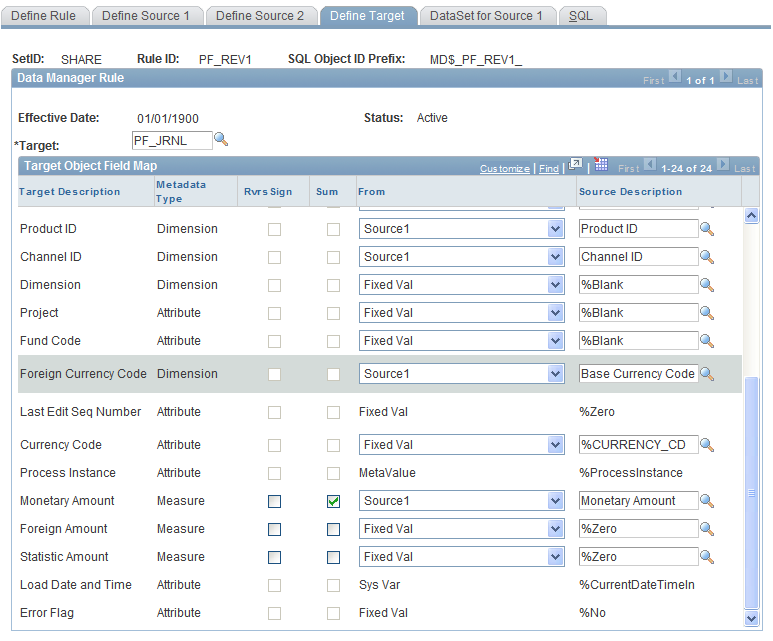
If you do not populate the Foreign Currency Code in the target definition, unexpected results may occur when the PF_POST application engine runs.
Data Manager Rules - DataSet for Source 1 Page
Use the Data Manager Rules - DataSet for Source 1 page (MD_DATASET1_DEFN) to review and define the source 1 fields and measures that are mapped to target fields.
Image: DataSet for Source 1 page
This example illustrates the fields and controls on the DataSet for Source 1 page. You can find definitions for the fields and controls later on this page.
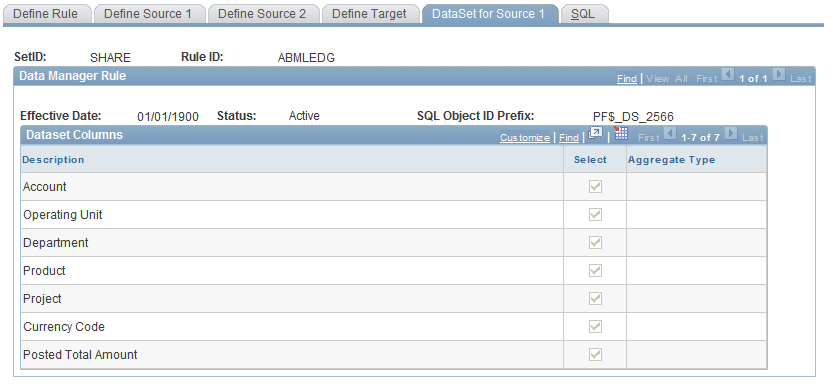
| Select |
Select this check box to include the dimension or measure. |
Note: The DataSet for Source 2 page does not display for the copy or GL Mapper method.
Data Manager Rules - DataSet for Common Dimensions Page
Use the Data Manager Rules - DataSet for Common Dimensions page (MD_DATASET3_DEFN) to review the mapped common dimensions and prorata measure.
Image: DataSet for Common DIMs page
This example illustrates the fields and controls on the DataSet for Common DIMs page.
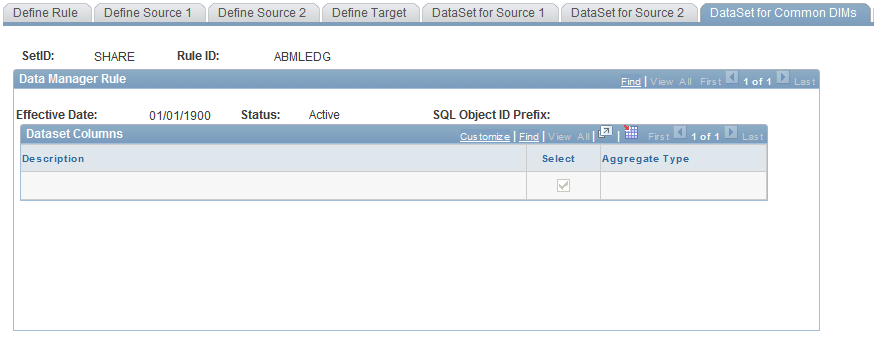
This page shows the common dimensions that exist between source 1 and source 2. A dimension is common if it has a matching description in the source 1 and source 2 datamap fields.
For the prorata method, the page also shows the prorata measure marked as Sum.
Note: Common dimensions are very important. They determine the join criteria for the method. The criteria are based on the datamap, so always review this page to ensure the results are calculating as you expect.
Data Manager Rules - SQL Page
Use the Data Manager Rules - SQL page (MD_RULE_TBL4) to review the generated SQL for the Data Manager rule.
Image: SQL page
This example illustrates the fields and controls on the SQL page.
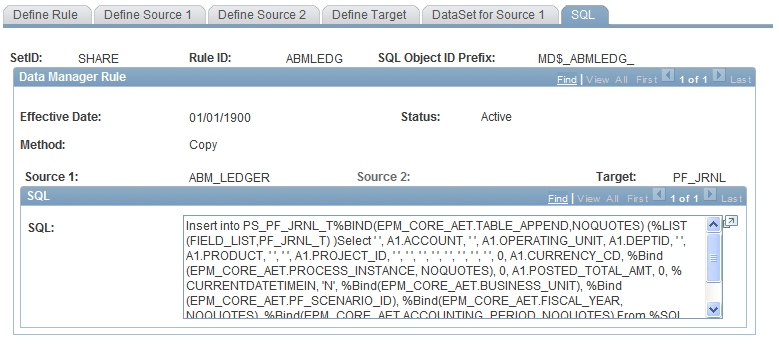
Once you have compiled a rule using the Compile button, review the generated SQL statement.
All %Bind and %SQL objects are resolved at run-time. There is only one SQL statement that is generated for each method.
A copy of this SQL is stored in the SQL repository with the SQL object ID prefix that is shown in this component. A sequential number for each SQL statement completes the SQL object name for the repository.