Understanding KPIs
This topic discusses:
KPIs.
Data elements.
KPI dimension members.
Assessments and target rules.
Activities and actions.
Calculation and assessment frequency.
KPIs
KPIs provide the metrics that are used within PeopleSoft analytic applications such as Scorecard and Workforce Analytics. They are derived from data within PeopleSoft EPM, or they can be based on manually maintained values. You obtain the information that you need to measure by defining KPI metadata and any additional calculations made to it. You also create the rules that control how KPI dimension members are assessed (how their score is determined). KPIs provide the link to PeopleSoft EPM data and enable you to automate the process of accessing key business data and measuring it against your goals.
In the Scorecard application, KPIs are associated with scorecard strategy components or strategic initiatives. However, this documentation describes KPIs before it discusses how to establish strategy components and scorecards. The topics are organized this way because KPIs must be set up before you can associate them with strategy components. Keep in mind that before you define KPIs, you should plan your strategy, because it determines which KPIs you need to create.
The following diagram outlines the steps for establishing KPIs, including: defining KPI building blocks; defining KPIs, including cause and effect relationships, calculation rules, and target rules; processing KPI security; entering values for manual KPIs; processing KPIs; viewing KPI results.
Image: Steps for setting up KPIs
Steps for setting up KPIs
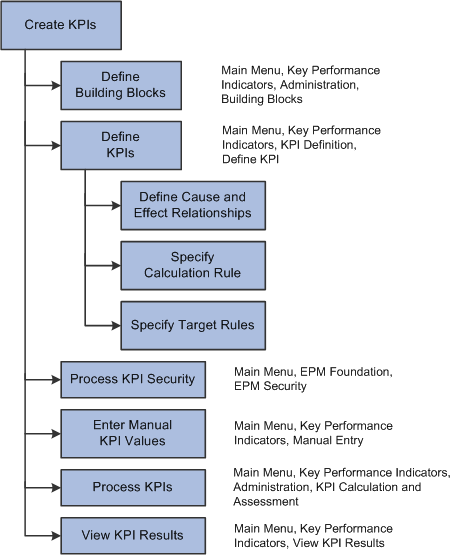
This topic discusses only the setup steps; processing and viewing KPIs are discussed in subsequent topics.
KPI Types
When you define a KPI, you use the KPI Type field to indicate how the system determines the KPIs value. A KPI can be one of the following types:
Calculated
Calculated KPIs are based on data in PeopleSoft EPM, and the system computes their values during processing.
Manual
Manual KPIs do not use data derived from PeopleSoft EPM tables to determine their values; instead, you enter their actual values using the Manual KPI page.
Composite
Composite KPIs are combinations of other KPIs. They help to track the performance of "soft" measures that aren't aggregates in a data warehouse. They can be based on any calculated KPIs, including other composite KPIs. Use them to compare and evaluate dimensions, such as customers, suppliers, channels, employees, and products across various attributes. The values for composite KPIs are obtained by summing their subordinate KPI values to produce an overall score. The KPIs used to form the composite can also be weighted, so that you can determine the percentage influence of each KPI on the overall score. You can use composite KPIs along with other KPIs in KPI portfolios. To analyze the results of a composite KPI and its component KPIs, use the KPI Analysis page.
For example, a good candidate for a composite KPI would be a KPI that measures customer value; it can be based on completely different measures like customer sales, number of support calls, and ability to use as a reference, and you can weight the importance of each of the measures to determine the overall customer value.
Derived
A derived KPI is one whose value is determined by using the KPI results from a previous processing run for either a different KPI or for the same KPI, but using a different time period, scenario, or business unit.
To indicate how a KPI is calculated, you associate it with a calculation rule. These rules can either be based on a calculation expression (an equation), or based on another KPI. If they are derived from another KPI, you can vary some of the parameters for the calculation. When you associate a calculation rule with a KPI, you must specify a model.
Calculation expressions are established on the Calculations - Expression page. You can use a combination of defined KPIs, data elements, constant values, or built-in functions within calculation expression equations.
All KPIs use target rules to determine their assessments, and the system can calculate and assess quarter-to-date and year-to-date totals depending on the options that you establish. Weekly calculations and assessments are not supported.
KPI Families
KPI families enable you to define a group of related KPIs, so that you can easily switch between KPIs within the same family when you view KPI results. The family can represent the same metric along different dimensions or represent totally separate KPIs that are in some way related to each other. Families are established per SetID. To create the family definitions, you use the KPI Family page. As you use the KPI Definition page to create new KPIs, you can associate them with a family. To view the results for the KPI family members, use the KPI Detail page; a drop-down list box enables you to view another KPI within the same family.
Hierarchical KPIs
When you define a KPI, if you associate the KPI with a tree that defines the organizational hierarchy for the dimension, you can view the KPI results hierarchically based on that tree, with results summarized at each node. This enables you to navigate through your existing business hierarchies such as departments, regions, and products without the need to create unique KPIs for each level in your organization. The tree is made up of nodes that depict the organizational hierarchy for that dimension, with leaves that are the detail dimension values—for example, the individual employee IDs for the employee dimension. For example, by associating a KPI that measures employee base pay with a tree that uses the employee dimension and has nodes for each department, you can view the KPI results (employee base pay) aggregated by department.
The Hierarchical KPI page shows the KPI results aggregated by the dimension tree hierarchy. The assessments for summary nodes are based on the assessment results for the detail values subordinate to each node.
Hierarchical KPIs have several requirements:
You must define tree metadata for the trees that are used for hierarchical KPIs.
During KPI processing, the system uses the flattened dimension tree to compute the aggregate node values. Tree metadata defines the name of the record that stores the flattened tree data. The record that is used is PF_TRFL_KPI_TBL. Delivered dimensions already have this information defined, but, if you create your own dimensions, you need to enter this record name in the Flattened Table field on the Tree Metadata page.
You must complete the detail fields for the tree structure associated with the dimension tree by using the Tree Structure - Details page in Tree Manager. This is to ensure that the roll up aggregation starts from the tree leaves (the detail values) instead of the tree nodes. The tree must be a summer tree.
You cannot use composite KPIs as hierarchical KPIs.
To use a manual KPI as a hierarchical KPI, do not select the No Aggregation check box on the KPI Definition - Add'l KPI Info page.
Data Elements
Data elements are a constraint-based subset of PeopleSoft EPM data, and are also referred to as a dataset. They can either result in a single value (a pointer) or retrieve multiple values that are grouped and subtotaled by dimension. They serve as the basis of calculated KPIs and can also be used as the target values upon which assessment results are based. They should be planned and set up in coordination with someone who is familiar with the PeopleSoft EPM database structure.
When you define a data element, the system creates a Structured Query Language (SQL) SELECT statement that extracts data from tables in the PeopleSoft EPM database to use within KPI expressions. For calculated KPIs, the data element is the key component that you must establish.
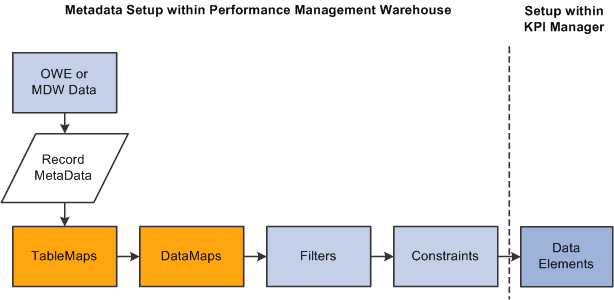
Data elements are based on constraints, which act as a filter and create the WHERE clause of the SQL SELECT statement that ultimately retrieves the data. Data elements are set up using KPI manager, but they require components that are established in PeopleSoft EPM. This diagram illustrates the relationship between data elements and their related PeopleSoft EPM database components:
Image: Relationship between data elements and Performance Management Warehouse components
Relationship between data elements and Performance Management Warehouse components
Use data elements to:
Define which EPM data to target and use.
Specify which dimension, such as product, customer, business unit, and so on, to use for calculations.
Control how to combine data (for example, sum, count, average, and so on).
KPI Dimension Members
KPI dimension members are the individual elements or rows of data that are described by a KPI. In most cases, a KPI returns more data than is pertinent to your scorecard. Therefore, you specify which dimension members to include for a KPI by using the Dimension Members page. The dimension members can be defined by a rule (constraint-based) or can be individually specified. Rules are useful for KPIs that deal with a large volume of data that often changes and is difficult to keep current, such as employee data. For example, by using a rule, you can specify that the KPI should include all employees in department A. The constraints upon which a rule is based are established in PeopleSoft EPM. The rule can be based only on information available about the specific dimension. In other words, the criterion that drives the selection must be associated with the specific dimension of the KPI and might require that you associate the dimension table with other PeopleSoft EPM database tables. You can preview the dimension members for rule-based KPIs to validate what is selected by the constraint. If you are not using a rule to define the dimension members, the system can retrieve all of the dimension members from which you can select the specific ones to include.
You can specify the relative importance of each dimension member by assigning weight factors. During assessment processing, weights are used only when strategy components use an assessment method of weighting. Also, you can't use weights if the KPI dimension members are business units.
Assessments and Target Rules
Assessments are the "scores" of a scorecard; that is, they indicate to what extent KPI dimension member results achieve their targets. You establish assessment definitions, such as green, yellow, or red, using the Assessment Definition page. On this page you define the image and text that appears for that assessment on the scorecard, and its assigned color in charts. You also define the assessment numeric equivalent— its value is used during scorecard assessment processing to determine actual assessment results, or to compute weights, depending on the assessment method used by the strategy component.
You associate assessments with KPI dimension members by establishing the rules for assessment results—in other words, the value ranges that correspond to each assessment—using the Target Rule page. Think of this as being equivalent to a grade scale. Use this page to define the target value and to establish rules to designate the ranges of actual values that result in a given assessment. Target rules are defined for each dimension member for the KPI. If the dimension members are based on a rule, then a single target rule is used for all the dimension members. If the dimension members are specified individually, then each dimension member must be assigned a target rule.
Target values can be based on:
Numeric values.
PeopleSoft EPM database values (using data elements).
A table of results that you manually maintain.
This table is referred to as the default target table.
A KPI.
The target rules compare a KPI dimension member's actual value to a target value or a percentage of the target. If that condition is true, the rule assigns the object the associated assessment. Target rules can:
Determine whether an object's value is within a specified percentage of the target value.
Compare an object's value to another data element's value.
Compare an object's value to a number that you enter.
Use the value of a dimension member from a different KPI as the basis for the comparison.
For any KPI, you can define target rules for three time frames—current period, quarter-to-date, and year-to-date. To determine quarter-to-date and year-to-date results, you must establish target rules for those time frames.
Activities and Actions
Using PeopleSoft Workflow, you can automatically send email messages or add items to a worklist based on assessment results. To do this, you establish the individual activities (the emails or worklist entries) using the Activity Definition page, and then associate one or more activities with an action using the Action Definition page. Actions are associated with KPIs on the Target Rule page. When you define the target ranges and their resulting assessments, you indicate what action, if any, takes place.
Calculation and Assessment Frequency
When you define a KPI, you can control when it is calculated (for calculated KPIs), or assessed, or both. These options are set up on the KPI Definition - Frequency page. If no specific calculation or assessment frequencies have been defined, the system calculates and assesses KPIs every time they are processed. The frequencies that are available are based on the calendar and associated frequencies defined for each business unit.
These settings enable you to control the monitoring of period-sensitive metrics such as earnings per share. For example, the value for earnings per share is reported only at quarter end and should affect the scorecard only at that time. Your organization might want to see the value for earnings per share each month on the scorecard as an indication of business performance. You might or might not want earnings per share assessed each month. However, earnings per share should affect the scorecard only when it is evaluated at the end of the quarter.
Note: Weekly scorecard assessments are not supported. Because a year does not break into full weeks, quarter to date (QTD) or year to date (YTD) values cannot be calculated correctly when using a weekly calendar, since end dates for a weekly calendar do not always fall on a month end date (which is how QTD and YTD roll up values are calculated). In a regular year, there are 52 weeks plus 1 day. In a leap year, there are 52 weeks plus 2 days.