Understanding Scorecards
This topic discusses:
Scorecard elements.
Scorecard IDs and descriptions for generated scorecards.
Strategy trees.
Assessment methods.
Scorecard Elements
A scorecard is a hierarchically related set of objectives that must be met to achieve an overall goal. These objectives are compared to established targets to monitor progress and identify potential obstacles. Scorecards are based on a strategy tree, which depicts the hierarchical structure of your objectives (the strategy components of the scorecard) from vision to strategic thrusts (STs ) to critical success factors (CSFs). The rule for how each component is scored is defined by its assigned assessment method. Key performance indicators (KPIs) are associated with scorecard components. The KPI results are evaluated to determine assessments, but KPIs are not part of the strategy tree. KPIs are associated with strategy components on the Strategy KPIs page.
When defining a scorecard, you specify the users or roles that will use the scorecard by completing a distribution list. When you run the Scorecard Assessment process, the system automatically generates the scorecards for every user that is included on the distribution list. This enables you to generate multiple scorecards by defining a single base scorecard.
Establishing a scorecard involves several steps:
Create a strategy tree and define its strategy components.
You use PeopleSoft Tree Manager to define the tree, and the Strategy Component page to define each strategy component.
Associate KPIs with strategy components.
Define cause-and-effect relationships among strategy components.
This is an optional step.
Define the base scorecard.
When you define the base, or template, scorecard, you associate the strategy tree with the scorecard, define the KPIs and dimension members to include, specify which assessments are treated as exceptions, specify the user IDs or roles for which to generate scorecards, and optionally identify any related KPIs.
Generate the individual scorecards by running the Scorecard Assessment Application Engine process (BSC_ASSESS).
The engine must be run to create each scorecard. The key fields for a scorecard include the Scorecard ID and the User ID. Each scorecard is personalized for the user for which it is generated. For each user, only the KPIs and dimension members that the user has permission to access appear in his or her personal scorecard, and assessments are determined by considering only the user's personal set of KPIs and dimension members.
Note: To enable other users to view a personal scorecard, you must establish the appropriate security for that scorecard by defining the security in PeopleSoft EPM.
These tasks are described in detail in this topic.
Workflow
During scorecard processing, the system sends email notifications to scorecard users the first time that a scorecard is generated and assessed for them. The system tracks whether a notification email has already been sent to a particular user. You can also notify all scorecard users when the scorecards are reprocessed by selecting an option on the Scorecard - Personalize For page.
Scorecard IDs and Descriptions for Generated Scorecards
Using the following logic, the system automatically generates the scorecard IDs and descriptions when it runs the Scorecard Assessment process:
To generate the scorecard IDs, the system combines the base scorecard ID with the sequence number from the distribution list.
To generate the scorecard descriptions, the system combines the base scorecard description with either the user ID description, or for roles, the user ID description of each user who is assigned to the role ID.
For roles, the system generates as many personal scorecards as correspond to the number of users who are assigned to the role.
For example, if four product managers are assigned to the role Product Manager, the system generates four personal scorecards. Individuals who are granted access to the scorecard ID for the role have access to all the personal scorecards that are generated from the role.
For example, assume that a base scorecard is defined with the following users entered in the distribution list:
|
Base Scorecard ID |
Description |
Distribution List |
Type |
|---|---|---|---|
|
CORPORATE |
Corporate Scorecard |
|
|
|
|
|
JSmith |
User |
|
|
|
MSmith |
User |
|
|
|
JDoe |
User |
|
|
|
Product Managers |
Role (Assume that four userIDs are associated with this role) |
The system-generated scorecards will have the following IDs and descriptions:
|
Generated Scorecard ID |
Generated Description |
|---|---|
|
CORPORATE1 |
Corporate Scorecard - John Smith |
|
CORPORATE2 |
Corporate Scorecard - Mary Smith |
|
CORPORATE3 |
Corporate Scorecard - John Doe |
|
CORPORATE4 |
Corporate Scorecard - ESC Product Mgr |
|
CORPORATE4 |
Corporate Scorecard - ABM Product Mgr |
|
CORPORATE4 |
Corporate Scorecard - FSI Product Mgr |
|
CORPORATE4 |
Corporate Scorecard - GC Product Mgr |
The list of dimension members that are defined on the base scorecard is the complete list of KPIs and dimension members to be considered for assessments; however, when determining assessments for the generated scorecards, the system considers only the KPIs and dimension members to which an individual user has been granted access.
Note: If you modify the distribution list or other aspects of the base scorecard after the system generates the personal scorecards, the changes are not considered until the next time you run the Scorecard Assessment process.
Strategy Trees
The strategy tree defines the hierarchical structure of the components of the scorecard. When defining a scorecard, you specify the strategy tree with which it is associated. When you use the various scorecard monitoring pages to review the progress of your strategy, you navigate through the strategy tree to view the results for each component. During the planning phases of Scorecard implementation, the appropriate members of an organization should meet to define the strategic goals and to sketch the scorecards that they plan to implement. These diagrams serve as the templates for the strategy trees that you create.
Note: This product documentation assumes that you are familiar with tree manager. If you are not, refer to your PeopleSoft Tree Manager documentation.
See PeopleTools: PeopleSoft Tree Manager
Three delivered sample trees exist in the SHARE SetID that you can review as examples. They are:
COMPANY_STRATEGY
DEPT_STRATEGY
GLOBAL_BUS_INTL
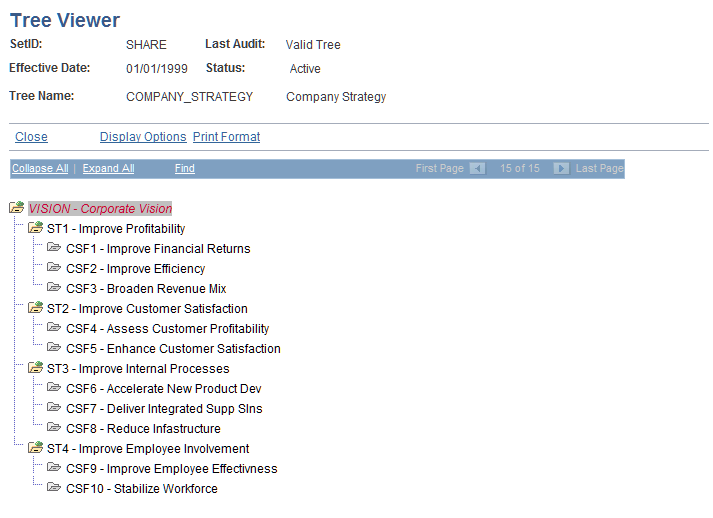
Here is the COMPANY_STRATEGY tree with all of its nodes expanded:
Image: COMPANY_STRATEGY tree
COMPANY_STRATEGY tree
When planning your scorecard, if you intend to strictly follow balanced scorecard theory standards, your strategy should be balanced across at least these four perspectives (you can also add other perspectives, if needed):
Financial
Customer
Internal
Learning
When you create your strategy tree, these perspectives typically correspond to the strategic thrust nodes that you create. CSFs are the child nodes beneath strategic thrusts. So the levels on the tree correspond to vision, strategic thrust, and CSF.
KPIs are not attached as nodes to the tree. You associate KPIs with their components using the Strategy KPIs page. As you add each node, the system displays the Strategy Component page, on which you enter details for that component.
Strategy Tree Structure Requirements
When you create strategy trees, you should use the BALANCED_SCARD structure that is provided within the SHARE SetID. If you choose to establish your own tree structure to use with strategy trees, use the values that are listed in the following table for the tree structure fields. Any fields that are not listed in this table can be populated with values that are appropriate for your organization, or you can use the default values for those fields. The Nodes tab is particularly important. Its fields control which page appears when you create a new node or edit data for an existing node, as well as the database records that are associated with the tree nodes.
|
Tab |
Field |
Value |
|---|---|---|
|
Structure |
Type |
Detail |
|
|
Additional Key Field |
SetID Indirection |
|
Levels |
Record Name |
TREE_LEVEL_TBL |
|
|
Page Name |
TREE_LEVEL |
|
Nodes |
Record Name |
BC_COMPONENT |
|
|
Field Name |
COMPONENT_ID |
|
|
Page Name |
BC_COMPONENT_DFN |
|
|
Component Name |
BC_COMPONENT_DFN |
|
|
Menu Name |
DEFINE_SCORECARDS |
|
|
Menu Bar Name |
SETUP |
|
|
Menu Item Name |
BC_COMPONENT_DFN |
|
Details |
All Fields |
Not applicable, leave blank. |
Strategy Tree Guidelines
You must follow these rules that are specific to strategy trees:
A specific KPI can be used only once on a scorecard.
The component with which a KPI is associated must be at the lowest level node on the strategy tree.
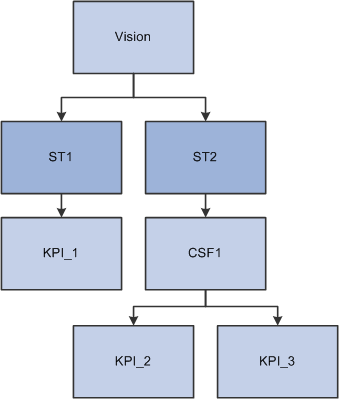
Whether that node is a critical success factor or strategic thrust doesn't matter, but it must be the lowest level node on that particular branch of the tree. For example, in the following diagram KPI_1, KPI_2, and KPI_3 are valid. If you associate a KPI with ST2, it would be ignored during assessment because the component it is attached to (ST2) has a component that is subordinate to it (CSF1):
Image: KPI association requirements
KPI association requirements
The system provides a query that audits this situation, the Strategy Trees with Non-Terminal KPIs query.
Assessment Methods
The assessment method controls how the system determines the score of a component. When you define a strategy component, you assign it an assessment method. Four assessment methods are available:
Best case
Worst case
Most frequent
Weighting
During scorecard assessment processing, assessment takes place starting at the lowest level of the strategy tree, then moves up the tree to score the components at each level. The system considers only the directly subordinate level when it determines the score for a given strategy component. Critical success factors are assessed first, then strategic thrusts, and finally, vision.
This table describes each assessment method and explains how it determines the resulting score for a component:
|
Assessment Method |
Resulting Score |
|---|---|
|
Best Case |
The single best assessment achieved by its subordinates is used. |
|
Worst Case |
The single worst assessment achieved by its subordinates is used. |
|
Most Frequent |
The most common score of its subordinates is used. In the case of a tie, the assessment method in the Tie Breaker field determines the result. |
|
Weighting |
The weighted average score of the subordinate KPIs is computed, and the corresponding assessment for that value, as defined in the weight scale, is used. (Use only for components that have KPIs as their only subordinates). |
For example, consider the CSF Broaden Sales Opportunities, for which subordinate KPI dimension members have received the assessments listed in this table:
|
KPI |
Dimension Member |
Assessment |
Numeric Equivalent |
|---|---|---|---|
|
Distributor Growth Rate |
Catalog Sales |
Yellow |
20 |
|
Distributor Growth Rate |
Internet Websites |
Green |
30 |
|
Total Sales by Product |
Office Furniture |
Red |
10 |
|
Total Sales by Product |
Home Outdoors |
Green |
30 |
|
Total Sales by Product |
Home Interior |
Yellow |
20 |
The assessment results for Broaden Sales Opportunities, depending on the assessment method that is used, are listed here. For this example, assume that the Tie Breaker field is set to Worst Case.
| Best Case |
Green |
| Worst Case |
Red |
| Most Frequent |
Yellow |
Weighting
When a strategy component uses weighting as its assessment method, the system computes a resolved weight for all the KPIs that are associated with that strategy component, and compares that number to an associated weight scale to determine the assessment results. The KPI dimension members are still compared with their defined targets during KPI processing, but the resulting numeric equivalent of the assessment is used in the weighting calculations.
The weight factors for each of the KPIs that are associated with a strategy component are entered on the Strategy KPIs page, enabling you to specify the relative importance of each KPI. You also use the Strategy KPIs page to assign the weight scale. You define weight scales on the KPI Weight Scale page. KPIs that have a weight factor of zero indicate that the KPI does not influence the overall score and are not considered.
Because each KPI might include several dimension members, the Weight Factor Allocation field on the Dimension Members page defines how the weight factor is distributed among the individual KPI dimension members. This enables you to indicate which dimension members within a given KPI should have a greater effect in determining the assessment. You can't use weight factors for business-unit based KPIs, because processing is carried out per business unit.
To compute the KPI weights, the Scorecard Assessment process first allocates the weight factor of the KPI to its members using the weight factor allocation that is defined for each member. If the KPI dimension members are defined by a rule, then all dimension members are assumed to have the same weight factor. Each KPI dimension member is then assigned an individual weight factor, which is stored in the database and appears on the appropriate scorecard pages.
The formula for determining the weight factor of each dimension member is:
(KPI Weight Factor) × (Weight Factor Allocation) ÷ 100
To determine the assessment of the strategy component, the system computes the overall weighted average by summing (KPIs Assessment Numeric Equivalent) × (KPI Dimension Member Weight Factor) for all KPIs and dividing the result by the sum of all the KPI weight factors. This amount is compared to the KPI weight scale to determine the final assessment.
This example shows how the weighting assessment is resolved. The Enhance Customer Satisfaction CSF has three KPIs associated with it: Customer Satisfaction Rating, On Time Delivery, and Number of Returned Shipments. Customer Satisfaction Rating is considered more important than the other two KPIs. These KPI weight factors are assigned on the Strategy KPIs page.
|
Strategy KPIs |
KPI Weight Factor |
|---|---|
|
Customer Satisfaction Rating |
60 |
|
On Time Delivery |
20 |
|
Returned Shipments |
20 |
Customer Satisfaction has a dimension of channel. On the Dimension Members page, two channels are specified: catalog sales and internet sales. Internet sales are considered more important than catalog sales, so these weight factor allocations are assigned on the Dimension Members page:
|
KPI Dimension Member |
Weight Factor Allocation |
|---|---|
|
Catalog Sales |
40 |
|
Internet Sales |
60 |
The Enhance Customer Satisfaction CSF uses this weight scale, which assigns the lower weighted average a lower assessment:
|
Lowest Value |
Highest Value |
Assessment |
|---|---|---|
|
0 |
17 |
Red |
|
18 |
27 |
Yellow |
|
28 |
999 |
Green |
The weight factors for the KPI dimension members for Enhance Customer Satisfaction are:
|
Strategy KPIs |
KPI Weight Factor |
KPI Dimension Members |
Weight Factor Allocation |
Calculation |
KPI Dimension Member Weight Factor |
|---|---|---|---|---|---|
|
Customer Satisfaction Rating |
60% |
Catalog Sales |
40% |
(60.00 × 40.00) ÷ 100 |
24.00 |
|
|
|
Internet Sales |
60% |
(60.00 × 60.00) ÷ 100 |
36.00 |
|
On-time Delivery |
20% |
Catalog Sales |
40% |
(20.00 × 40.00) ÷ 100 |
8.00 |
|
|
|
Internet Sales |
60% |
20.00 × 60.00 ÷ 100 |
12.00 |
|
Returns |
20% |
Catalog Sales |
40% |
20.00 × 40.00 ÷ 100 |
8.00 |
|
|
|
Internet Sales |
60% |
20.00 × 60.00 ÷ 100 |
12.00 |
KPI assessments are determined by their target rule; weight factors apply only to strategy components, and are not considered when the system assesses KPIs. The KPI assessment results are shown in this table:
|
Strategy KPIs |
KPI Dimension Members |
KPI Assessment |
|---|---|---|
|
Customer Satisfaction |
Catalog Sales |
Green |
|
|
Internet Sales |
Yellow |
|
On-time Delivery |
Catalog Sales |
Green |
|
|
Internet Sales |
Red |
|
Returns |
Catalog Sales |
Green |
|
|
Internet Sales |
Red |
The assessment numeric equivalent for red is 10, yellow is 20, and green is 30.
The formula for computing the weighted average is:
The sum of ((KPIs Numeric Equivalent for the Assessment Value) × (KPI Dimension Member Weight Factor)) for all KPIs divided by the sum of all the weight factors.
This table shows the results:
|
KPI |
Dimension Member |
Assessment Numeric Equivalent |
Dimension Member Weight Factor |
Calculation |
Result |
|---|---|---|---|---|---|
|
Customer Satisfaction Rating |
Catalog Sales |
Green 30 |
24.00 |
30 × 24.00 |
720 |
|
|
Internet Sales |
Yellow 20 |
36.00 |
20 × 36.00 |
720 |
|
On-time Delivery |
Catalog Sales |
Green 30 |
8.00 |
30 × 8.00 |
240 |
|
|
Internet Sales |
Red 10 |
12.00 |
10 × 12.00 |
120 |
|
Returns |
Catalog Sales |
Green 30 |
8.00 |
30 × 8.00 |
240 |
|
|
Internet Sales |
Red 10 |
12.00 |
10 × 12.00 |
120 |
|
Total |
|
|
100 |
|
2160 |
|
Calculation |
2160 ÷ 100 |
|
|
|
|
|
Weighted Average for Enhance Customer Satisfaction |
21.60 |
|
|
|
|
The system determines the overall assessment for customer satisfaction based on where the weighted average occurs within the weight scale value ranges. The weighted average must be equal to or greater than the lowest value and equal to or less than the highest value.
Using the defined weight scale, the weighted average of 21.60 is equal to or greater than 18 and equal to or less than 27, so the Customer Satisfaction CSF receives a yellow assessment.