Understanding Supplier Rating System Scorecard
Supplier Rating System enables companies to make informed supply decisions that are optimal for the entire business. These decisions can include identifying the best supplier to select for a specific contract or determining entirely new supply strategies, such as which product areas would benefit from an expanded supplier base or consolidation of existing suppliers.
By collecting critical process information from across your organization—financial systems, manufacturing systems, and distribution systems—Supplier Rating System provides you with a complete, view of each supplier's performance. All of this information is combined into a supplier scorecard that is constantly updated and accessible across your company and to the supplier. This comprehensive data-collection process ensures data integrity when critical decisions are made.
Supplier Rating System analytics ensure that each measure of supplier performance is expressed in a format that can be objectively scored. The system includes over 80 KPIs, such as on-time delivery and % invoiced correctly, that provide an objective basis for supplier comparison. You can use different combinations and prioritizations of these KPIs to evaluate suppliers for each unique decision. The system highlights each supplier's strengths and weaknesses across multiple areas, and quantifies the supplier's fit for each specific request, enabling your employees to become more strategic buyers.
Supplier Rating System enables you to use preconfigured KPIs to analyze supplier performance. It is delivered with two preconfigured rating models that enable you to analyze performance using overall scores.
You can use the analytical information that Supplier Rating System includes to assist in selecting, monitoring, and evaluating current and future suppliers. Prior to requesting quotations from suppliers, buyers can be presented with a list of potential suppliers based on scores derived from Supplier Rating System. You can also use the scores and rankings to evaluate bidders from the bid management process, eliminating financially weak suppliers or suppliers with historically poor quality.
You can use Supplier Rating System along with Scorecard to organize KPIs into portfolios, and then analyze the portfolios using charting and weighting tools. You can use the Supplier Rating System KPIs to produce scores that can be made available to internal and external users.
Supplier Rating System includes two predefined scorecards, one of which is designed for your employees to use to analyze suppliers. The second scorecard is designed to provide your suppliers with a view of the summarized data on supplier performance through the PeopleSoft Supply Chain portal. The data can be accessed through three portal pagelets that are designed specifically for Supplier Rating System. Supplier Rating System also includes all portal pagelets that are delivered with Scorecard.
Supplier Rating System delivers two preconfigured models that are composed of specially designed composite KPIs. These are KPIs that are arranged in a hierarchy that produces a numerical score. The two models are Overall Rating (Compact) and Supplier Rating. You can view the structure of the models on the KPI Analysis page.
Supplier Rating System also enables you to integrate Dun & Bradstreet data for use with KPIs. Your supplier information can be exported to Dun & Bradstreet and imported into PeopleSoft EPM, to be used with fourteen preconfigured KPIs that are specifically designed to use Dun & Bradstreet data. The Dun & Bradstreet data addresses financial stability, demographics, socioeconomic factors, and corporate linkage for additional enrichment.
Note: The Dun & Bradstreet license is a separate license. To use Dun & Bradstreet data, you must be licensed to do so.
This topic discusses:
Scorecards and strategy components
KPIs
Batch processes
See also PeopleSoft Enterprise Performance Management Portal Pack and PeopleSoft Enterprise Performance Management Fundamentals.
Scorecards and Strategy Components
A scorecard is the visual representation of the objectives that your organization is striving to achieve. The foundation of a scorecard is a strategy tree that comprises hierarchical nodes of strategy components.
Strategy components are the elements that make up your strategy and are the nodes on your strategy tree. Vision, strategic thrusts, and critical success factors are all strategy components, and represent the goals that your organization is trying to achieve. KPIs, which measure how well an organization is achieving those goals, are attached to scorecard strategy components, typically critical success factors.
Supplier Rating System delivers the scorecards SRS Buyer Scorecard and SRS Supplier Scorecard, which work with Scorecard to provide an up-to-date summary of how your organization is meeting its project development objectives. The following table lists the field values that are used by these scorecards. You can expand on these scorecards to suit your implementation.
KPIs
A KPI defines the data value or calculation from the PeopleSoft EPM database that is evaluated to determine how well an organization is meeting its critical success factors.
Supplier Rating System delivers a set of preconfigured KPIs that provide executive and middle management with the tools to analyze supplier performance. These KPIs have been developed in conjunction with leading consultants to:
Reduce purchasing cost.
Reduce lead-time variability.
Improve invoice accuracy.
Improve supplier quality.
Provide buyer feedback ratings.
Provide supplier financial ratings.
The delivered KPIs use a naming convention: All the KPI IDs begin with SRM_. They use an object type of Supplier that uses data from inventory, purchasing, receiving, and voucher tables.
Supplier Rating System includes preconfigured KPIs that are designed specifically for use with Dun & Bradstreet data. This table lists KPIs and explains what each measures:
|
KPI Name |
What It Measures |
|---|---|
|
Credit Score |
A statistically modeled score predicting the business establishment's probability of delinquent payment within the next 12 months. The score is derived from various Dun & Bradstreet data, including payment history, credit rating, year started, Standard Industry Code (SIC), and other data. The score range is from 0 to 100. The higher the credit score, the lower the probability of delinquency. See your configured risk thresholds for mapping to risk categories. |
|
Current Paydex |
A two-digit score, exclusive to Dun & Bradstreet, that appraises the payment history of a company. This index is derived from the currency-weighted average of the combined individual payment experiences of a company. |
|
Current Ratio |
A measure of short-term solvency: the ability of the supplier to pay its liabilities on time. Current Ratio = Current Assets / Current Liabilities. Current Assets: The current value of a business including property, cash, and so on. Current Liabilities: The current debts outstanding of a business. |
|
Dun & Bradstreet Rating |
A general classification based on estimated strength and composite credit appraisal. The first two positions represent the net worth of the company. The last position is the composite credit appraisal that is assigned to the company by Dun & Bradstreet's business analyst. These are the four composite credit appraisals: 1 = High, 2 = Good, 3 = Fair, 4 = Limited. |
|
Debt to Equity Ratio |
Total Debt / Net Worth. Total Debt: The total of debt that is incurred by a business. Net Worth: The net worth or equity of the business. |
|
Financial Stress Percentile |
The incidence of financial stress is the proportion of firms with scores in this range that discontinued operations with loss to creditors. The financial stress percentage for a specific class is based on historical data in the Dun & Bradstreet file. |
|
Financial Stress Percentile - Average incidence |
The incidence of financial stress is the proportion of firms with scores in this range that discontinued operations with loss to creditors. The national average incidence of financial stress is based on historical data in Dun & Bradstreet files. |
|
Financial Stress Percentile - Industry |
The relative rating of a company among all of the scorable companies in its own industry group. |
|
Financial Stress Percentile - Industry Incidence |
The proportion of firms with scores in this range that discontinued operations with loss to creditors. The industry-specific average incidence of financial stress is based on historical data in Dun & Bradstreet files. |
|
Financial Stress Percentile - National |
The relative rating of a company among all of the scorable companies. |
|
Financial Stress Score |
A statistically valid score predicting the potential for failure of a business establishment and the likelihood that a company will obtain legal relief from creditors in full over the next 18 months. Branch records are populated from the headquarters record. |
|
Net Sales to Assets |
Sales Volume / Total Assets. Sales Volume: The value of the sales of a company for a 12-month period. Total Assets: The total value of cash and property of a business. |
|
Supplier Evaluation Risk Score |
Predicts the likelihood of a firm ceasing operations without paying all creditors under state or federal law over the next 18 months. The score, which is on a 1 (lower risk) to 9 (higher risk) scale, uses statistically valid models that are derived from the Dun & Bradstreet extensive data files. Information such as age of business, payment trends and performance, financial ratios compared with industry averages, sales and profitability, and so on, are considered in the calculation of the supplier evaluation risk score. Branch records are populated from the headquarters record. |
|
Working Capital to Assets |
(Current Assets – Current Liability) / Total Assets. Total Assets: The total value of cash and property of a business. Current Assets: The current value of a business, including property, cash, and so on. Current Liabilities: The current debts outstanding of a business. |
The supplier rating models enable you to group and weigh key measures of supplier performance into performance categories that are subsequently weighted and grouped into an overall composite supplier score. The score is then compared to a rating scale and assigned a rating, much like a report card in school or automobile crash test ratings from the federal government. The following table shows an example supplier rating for Acme, Inc. The following rating (assessment) rules apply for this example: A >= 90, B>= 80, C >= 70, D >= 60, F <= 59.
|
Category |
Desc. |
Attribute |
Weight |
Value |
Target |
Score |
Rating |
|---|---|---|---|---|---|---|---|
|
C1 |
Acme, Inc. |
|
|
83 |
|
83 |
B |
|
CKPI1(Composite KPI) |
Shipment accuracy |
Higher is better |
.30 |
89 |
90 |
99 |
A |
|
CKPI1 is a composite of these KPIs: |
|
|
|
|
|
|
|
|
KPI1 |
Shipped quantity |
Higher is better |
.50 |
900 |
1000 |
90 |
A |
|
KPI2 |
Shipped quantity correct |
Higher is better |
.30 |
92 |
98 |
94 |
A |
|
KPI3 |
Under shipped quantity |
Lower is better |
.10 |
5 |
3 |
60 |
D |
|
KPI4 |
Over shipped quantity |
Lower is better |
.10 |
0 |
1 |
100 |
A |
|
CKPI2 |
Quality performance |
Higher is better |
.50 |
62 |
90 |
69 |
D |
|
CKPI2 is a composite of these KPIs: |
|
|
|
|
|
|
|
|
KPI5 |
Accepted % of shipped quantity |
Higher is better |
.50 |
80% |
95% |
84 |
B |
|
KPI6 |
Returned % of shipped quantity |
Lower is better |
.50 |
5% |
2% |
40 |
F |
|
CKPI3 |
On time performance |
Higher is better |
.20 |
88 |
95 |
93 |
A |
|
CKPI3 is a composite of these key KPIs: |
|
|
|
|
|
|
|
|
KPI7 |
% of shipments on time |
Higher is better |
.80 |
78% |
90% |
87 |
B |
|
KPI8 |
% of shipments early |
Lower is better |
.05 |
4% |
5% |
125 |
A |
|
KPI9 |
% of shipments late |
Lower is better |
.15 |
6% |
5% |
83 |
B |
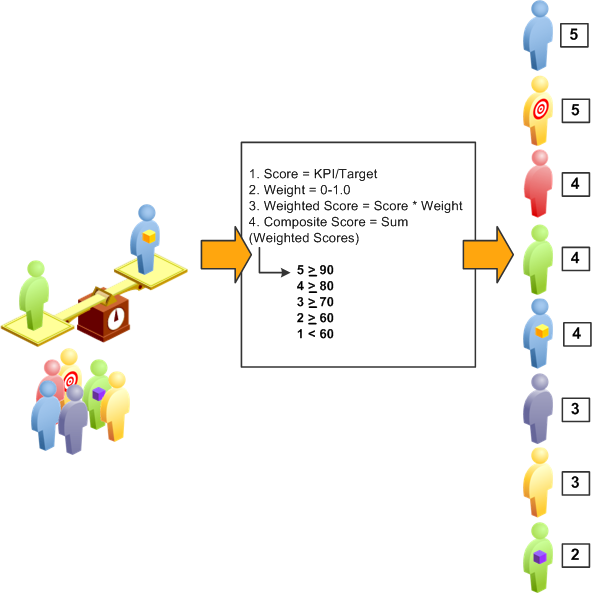
This figure illustrates KPI calculations:
Image: KPI calculations
KPI calculations
Batch Processes
You must run the following jobstreams to populate key tables:
KP_ANALYZE
This jobstream populates KP_KPI_CALC_F00 and KP_KPI_ASMT_F00. Run this jobstream to validate the KPI calculation rules, verify end values, and test the KPI assessment rules.
BC_ANALYZE
This jobstream populates KP_KPI_CALC_F00, KP_KPI_ASMT_F00, and BC_ASSESS_F00. Run this jobstream to generate the final scorecard assessments after you validate your setup (by running KP_ANALYZE). If you set up this job to run regularly, the KPI process can aggregate data month-to-month and year-to-date. You must run this process after you populate or update the PeopleSoft EPM warehouse tables (such as during the Extract Transform and Load (ETL) process) to view current results for your Supplier Rating System Scorecard.