Creating and Viewing Dashlets
This topic provides an overview of the KPI Dashboard, lists common elements, and discusses how to:
Create and view KPI dashboards.
Specify dashlet format and time period.
Define the dashlet data.
Specify table options.
Specify chart options.
Pages Used to Create and View Dashlets
|
Page Name |
Definition Name |
Navigation |
Usage |
|---|---|---|---|
|
KPI Dashboard |
KP_DASHBOARD |
|
Create and view KPI dashboards. |
|
Create new Dashboard |
KP_NEW_DASHBOARD |
On the KPI Dashboard page, click Create New Dashboard. |
Name a new KPI dashboard. |
|
Dashlet Definition - Basic Information |
KP_DLET_WIZARD_1 |
On the KPI Dashboard page, click the Configure Dashlet button. |
Specify dashlet format and time period. |
|
Dashlet Definition - Data |
KP_DLET_WIZARD_2 |
|
Define the KPI data to use for a dashlet. |
|
Choose KPIs |
BC_DO_SELECTION |
On the Dashlet Definition - Data page, click Select KPIs to Display. |
Select the KPIs to include in a dashlet. |
|
Choose Dimension Members |
BC_DO_SELECTION_1 |
On the Dashlet Definition - Data page, click Select Dimension Members. |
Select the dimension members to include in a dashlet. |
|
Dashlet Definition - Table Details |
KP_DLET_WIZARD_3 |
|
Specify table display options. |
|
Dashlet Definition - Chart Details |
KP_DLET_WIZARD_3C |
|
Specify chart display options. |
Understanding the KPI Dashboard
The KPI Dashboard enables you to view and create KPI dashlets. KPI dashlets are small pages that provide display-only snapshots of KPI results. You can create dashlets that contain KPI data in either a graphical or grid-based table format. The KPI Dashboard includes a control panel, the dashlet display area, and the KPI Dashboard Wizard. When you access the KPI Dashboard component, the system displays the default dashboard. Initially, the default dashboard is the delivered dashboard configuration, My Dashboard (Default). which contains two empty dashlets in the dashlet display area. Subsequently when you access the component, whichever configuration you save as your default configuration will be active. You can either modify and save the My Dashboard (Default) configuration or create a new dashboard and set it as your default dashboard. If at some point you delete all saved dashboard configurations, the system generates a new My Dashboard (Default) configuration with two empty dashlets in the dashlet display area.
Image: KPI Dashboard
This example illustrates the fields and controls on the KPI Dashboard. You can find definitions for the fields and controls later on this page.

KPI Dashboard Wizard
The KPI Dashboard Wizard provides a user-friendly, browser-based graphical user interface (GUI) that leads you through the series of steps involved in creating and publishing a KPI dashlet.
You do not need to have PeopleSoft-specific application development tools or skills to use the KPI Dashboard Wizard to create dashlets. During the dashlet-creation process, the KPI Dashboard GUI presents a series of numbered steps. Each step appears in a numbered path at the top of the KPI Dashboard Wizard pages to indicate where you are in the dashlet-creation process.
Image: KPI Dashboard Wizard
This example illustrates the fields and controls on the KPI Dashboard Wizard. You can find definitions for the fields and controls later on this page.
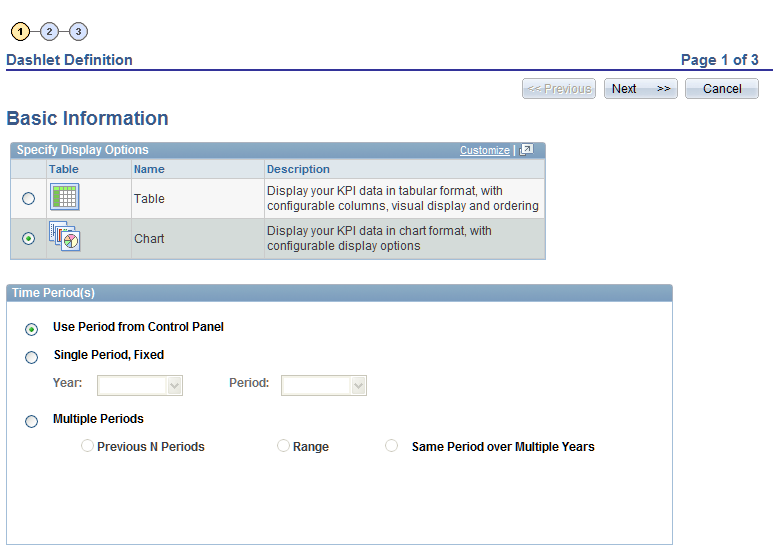
This labeled path assists you in navigating through the steps, and it enables you to review or edit dashlet definition values. When you've completed a step, KPI Dashlet Wizard automatically takes you to the next appropriate step. The Dashlet Wizard GUI leads you through the following steps that are used to create a dashlet:
Select the display format.
Specify the timeframe.
Define the KPI data to use.
Configure the chart or table, and preview the chart.
KPI Dashboard Control Panel
The dashboard control panel is a collapsible group box on the KPI Dashboard page that enables you to:
Load, save, and delete dashboard configurations.
Specify which business unit, scenario, fiscal year, and period to view.
The system automatically uses the business unit and scenario that are specified in your profile definition, but you can specify other values. If you have not yet established a profile, the system automatically transfers you to the My Profile page, where you can define these values. You can save multiple dashboard configurations, identifying them by assigning a name.
Common Elements Used in This Creating and Viewing Dashlets

KPI Dashboard Page
Use the KPI Dashboard page (KP_DASHBOARD) to create and view KPI dashboards.
Image: KPI Dashboard page
This example illustrates the fields and controls on the KPI Dashboard page. You can find definitions for the fields and controls later on this page.
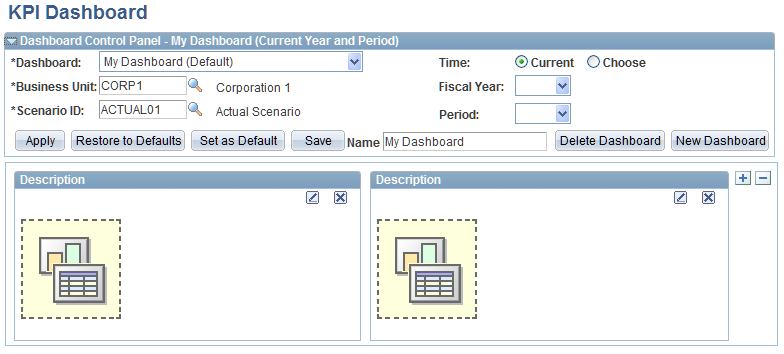
Dashboard Control Panel - <dashboard name> (<year and period>)
Dashlet Rows
The area of the page below the Dashlet Control Panel group box contains your dashlets. When you first access this page, it contains a single row with two undefined dashlets. Use the following buttons to interact with the dashlets:


Dashlet Definition - Basic Information Page
Use the Dashlet Definition - Basic Information page (KP_DLET_WIZARD_1) to specify dashlet format and time period.
Image: Dashlet Definition - Basic Information page
This example illustrates the fields and controls on the Dashlet Definition - Basic Information page. You can find definitions for the fields and controls later on this page.
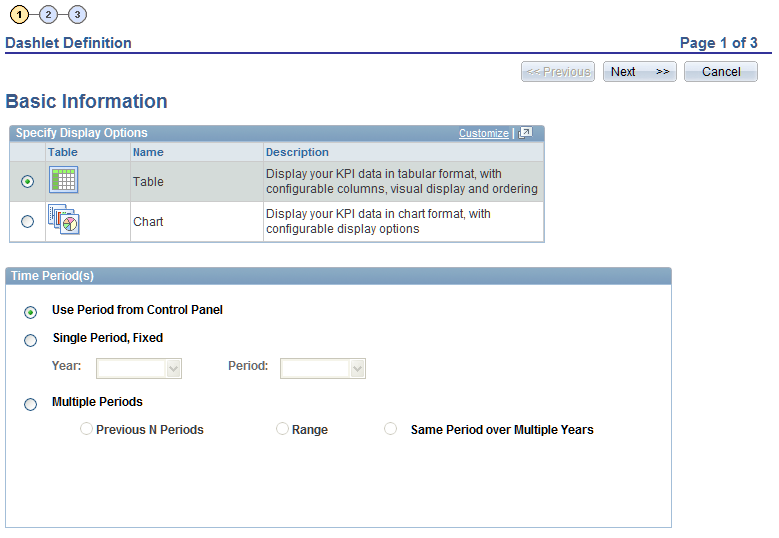
Specify Display Options
| Table |
Select to configure a dashlet that displays information using a grid. |
| Chart |
Select to configure a dashlet that displays information using a chart. |
Time Period(s)
Specify the time period for which to display KPI data.
Dashlet Definition - Data Page
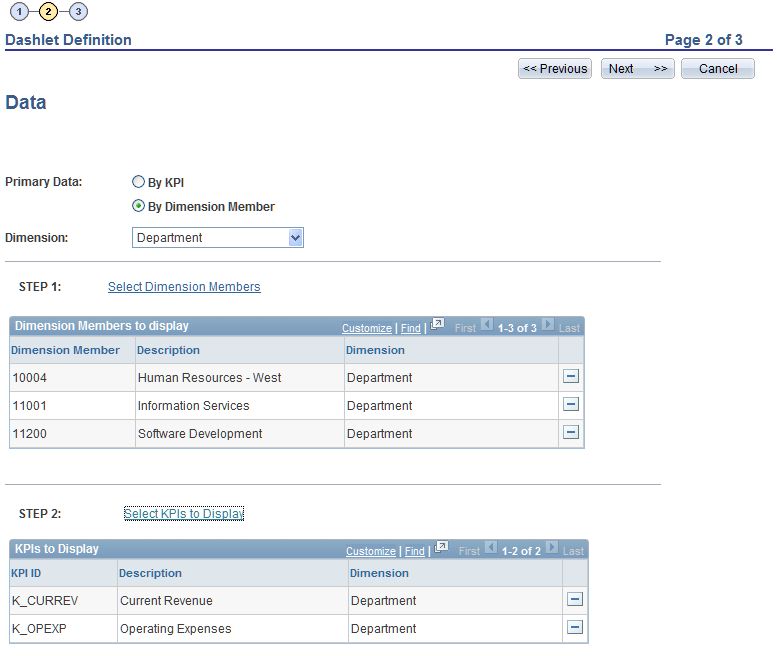
Use the Dashlet Definition - Data page (KP_DLET_WIZARD_2) to define the KPI data to use for a dashlet.
On the Dashlet Definition - Basic Information page, click Next or 2.
Click the number 2 from any of the other pages in the KPI Dashboard Wizard.
Image: Dashlet Definition - Data page
This example illustrates the fields and controls on the Dashlet Definition - Data page. You can find definitions for the fields and controls later on this page.
Dashlet Definition - Table Details Page
Use the Dashlet Definition - Table Details page (KP_DLET_WIZARD_3) to specify table display options.
On the Dashlet Definition - Data page for a table-based dashlet, click Next or 3.
Click the number 3 from any of the other pages in the KPI Dashboard Wizard.
Image: Dashlet Definition - Table Details page
This example illustrates the fields and controls on the Dashlet Definition - Table Details page. You can find definitions for the fields and controls later on this page.
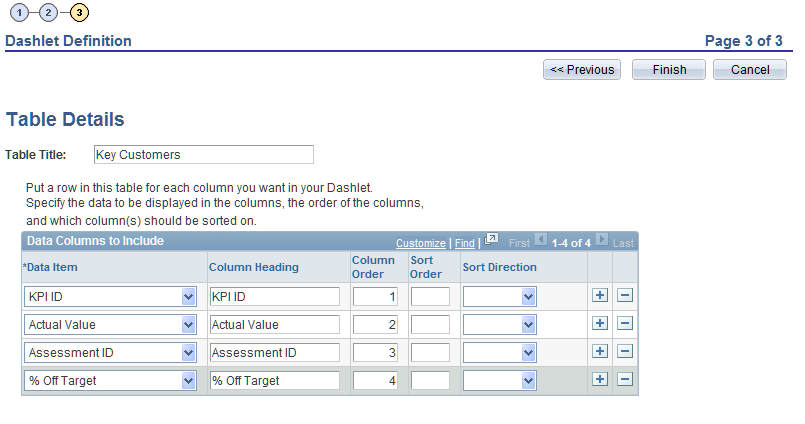
| Table Title |
Enter the text to use for the table. |
Data Columns to Include
Insert rows as needed and complete the fields within this grid to define the columns and layout for the table.
Dashlet Definition - Chart Details Page
Use the Dashlet Definition - Chart Details page (KP_DLET_WIZARD_3C) to specify chart display options.
On the Dashlet Definition - Data page for a chart-based dashlet, click Next or 3.
Click the number 3 from any of the other pages in the KPI Dashboard Wizard.
Image: Dashlet Definition - Chart Details page
This example illustrates the fields and controls on the Dashlet Definition - Chart Details page. You can find definitions for the fields and controls later on this page.
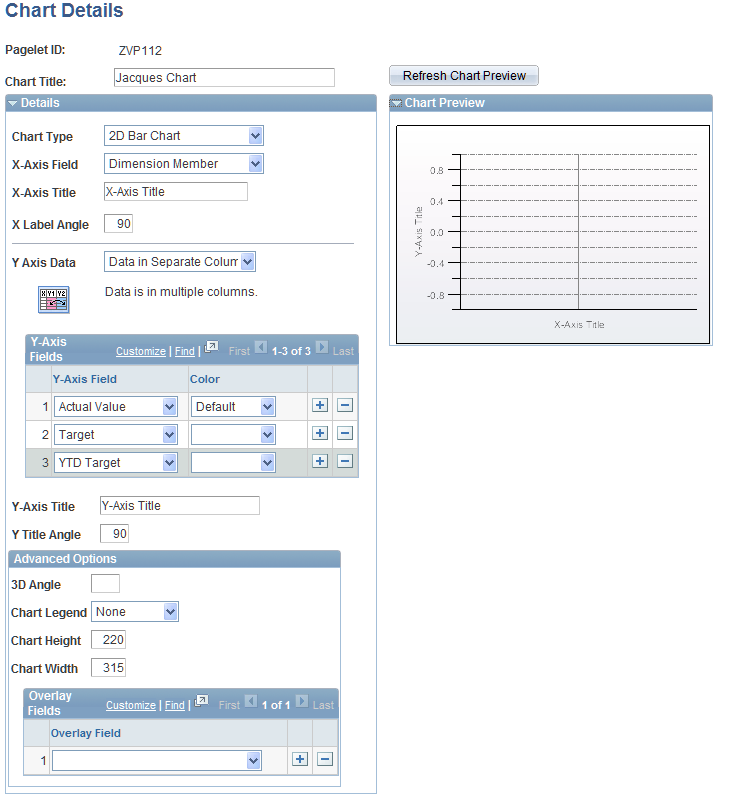
To generate a chart pagelet using Pagelet Wizard, you include information that is related to the chart's x axis and y axis. The y axis is the axis that contains the KPI data. In most charts, the y axis is the vertical axis. However, in a horizontal bar chart, the y axis is the horizontal axis. The x axis is the axis against which the y-axis data is measured.
Chart Options
Advanced Options