Viewing PeopleSoft Scorecard Data Through Pagelets
This section discusses how to:
View the My Favorites pagelet.
View the KPI List pagelet.
View the Perspective Assessment pagelet.
View the KPI Ranking 2 pagelet.
View the KPI Comparison Ranking 2 pagelet.
View the Single KPI Detail pagelet.
View the Object Ranking pagelet.
My Favorites Pagelet
Use the My Favorites pagelet to display information about scorecard components and KPIs that you selected as favorites.
Displays assessment information for KPIs and strategy components by component type.
On the Portal Preferences page, users can select the following preferences:
Field to sort by (PCT_OF_TARGET or RESOLVED_VALUE).
Sort order (ascending or descending).
KPI List Pagelet
Use the KPI List pagelet to view assessment results for KPIs that belong to the default user-specified scorecard in the My Profile component.
Image: KPI List pagelet
This example illustrates the fields and controls on the KPI List pagelet.
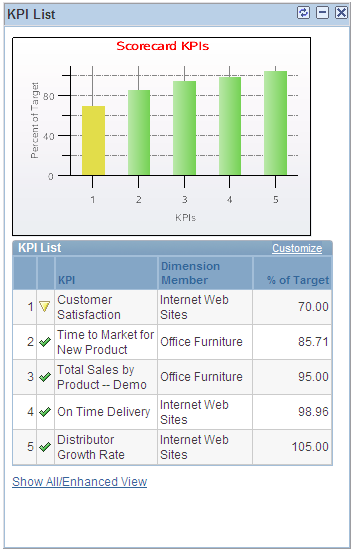
Displays assessment results and a bar chart of KPI performance. The KPIs are sorted based on user preference. The KPI dimension and percent of target also appear.
This pagelet displays the first five rows of data. Click the Show All/Enhanced View link to view additional rows in the extension pagelet. The extension pagelet additionally displays trend, actual value, and target (the target value).
On the Portal Preferences page, users can select the following preferences:
Field to sort by (PCT_OF_TARGET or RESOLVED_VALUE).
Sort order (ascending or descending).
Perspective Assessment Pagelet
Use the Perspective Assessment pagelet to view assessment results for your default scorecard and is categorized by perspective.
Displays assessment information for each perspective of your scorecard. Use this pagelet to view how well each category is achieving its goals. This pagelet shows the first five rows of data.
KPI Ranking 2 Pagelet
Use the KPI Ranking 2 pagelet to view a detailed list or chart of the top dimensions, such as top customers, channels, or suppliers. This information is based on the KPI and preferences that users specify on the Portal Preferences page.
The system retrieves data according to the preferences set on the Portal Preferences page. There are four KPI ranking pagelets. You can display different dimensions on each KPI ranking pagelet by selecting different KPIs for each pagelet. For example, you can use one pagelet to display top suppliers and another pagelet to display top projects. To define the data that appears on these pagelets, access the Portal Preferences page and select the following preferences:
Business unit.
Scenario ID.
Show percent of target.
Show resolved value.
Meaningful label (for example, Top Suppliers).
Show assessment.
Show trend indicator.
Display preference (display the chart only, the list only, or both the list and chart).
Field to sort by (PCT_OF_TARGET or RESOLVED_VALUE).
Sort order (ascending or descending).
One KPI.
Click the KPI Analysis link to access the KPI Analysis page and view more rows of data, perform detail analysis, and perform a what-if analysis.
KPI Comparison Ranking 2 Pagelet
Use the KPI Comparison Ranking 2 pagelet to view a comparison list of the top dimensions, such as top customers, channels, or suppliers for the week. This information is based on the preferences and two KPIs that users specify on the Portal Preferences page.
The system retrieves data according to the preferences set on the Portal Preferences page. There are four KPI ranking pagelets; display different dimensions on each KPI comparison ranking pagelet by selecting different sets of KPIs for each pagelet. For example, you can use one pagelet to display top suppliers this week and another pagelet to display top projects this week. To define the data that appears on these pagelets, access the Portal Preferences page and select the following preferences:
Business unit.
Scenario ID.
Meaningful label (for example, Top Projects This Week).
Display preference (such as the percent of target, assessment, resolve value, or trend).
Field to sort by (PCT_OF_TARGET or RESOLVED_VALUE).
Sort order (ascending or descending).
Two KPIs.
The first KPI users select is the driving KPI and is the one that the system uses to get the data that they need; the second KPI offers supporting information.
Users can click the KPI Analysis link to access the KPI Analysis page and view more rows of data based on the first KPI.
Single KPI Detail Pagelet
Use the Single KPI Detail pagelet to view details of a single KPI and dimension, such as value, target, assessment, and trend. This information is based on the KPI, dimension, and preferences that users specify on the Portal Preferences page.
The system retrieves data according to the preferences set on the Portal Preferences page. There are four KPI ranking pagelets. You can display different KPI dimensions on each single KPI detail pagelet by selecting a different KPI and dimension for each pagelet. For example, you can use one pagelet to display customer satisfaction for the catalog sales dimension and another pagelet to display customer satisfaction for the Internet sales dimension. To define the data that appears on these pagelets, access the Portal Preferences page and select the following preferences:
Business unit.
Scenario ID.
Show resolved value.
Meaningful label (for example, Customer Satisfaction This Week).
Show assessment.
Show KPI target.
Show trend indicator.
One KPI and one dimension.
Users can click the KPI Analysis link to access the KPI Detail page and view additional information for that single KPI.
Object Ranking Pagelet
Use the Object Ranking pagelet to view an informational list of the top dimensions, such as top customers, channels, or suppliers for the week. This information is based on the KPI and preferences that users specify on the Pagelet Preferences page.
The system retrieves data according to the preferences set on the Portal Preferences page. There are four KPI ranking pagelets. You can display different dimensions on each object ranking pagelet by selecting different KPIs for each pagelet. For example, you can use one pagelet to display top suppliers and another pagelet to display top projects. These pagelets are exactly like the KPI ranking pagelets, except that these pagelets do not have row-level security and do not show numeric values for the dimensions. They are for informational purposes only and are intended for display on your company's web site (for viewing by customers and suppliers). To define the data that appears on these pagelets, access the Portal Preferences page and select the following preferences:
Business unit.
Scenario ID.
Meaningful label (for example, Top Channels This Week).
Field to sort by (PCT_OF_TARGET or RESOLVED_VALUE).
Sort order (ascending or descending).
One KPI.