Viewing KPI Results
The pages discussed in this topic enable you to review KPIs when they are not associated with a scorecard. This topic discusses how to:
View KPIs that meet specific criteria.
View KPI details.
Compare KPIs graphically.
Review your own KPIs.
Review KPI portfolios.
Analyze KPIs and composite KPIs.
Change weighting of composite KPIs.
Use a KPI tree for KPI analysis.
Review hierarchical KPIs.
Pages Used to View KPI Results
|
Page Name |
Definition Name |
Navigation |
Usage |
|---|---|---|---|
|
KPI Filter Search |
BC_KPI_OBJ_FILTER |
|
View KPIs that meet specified criteria. |
|
KPI Filter List |
BC_KPI_OBJ_LIST |
Click Get KPIs on the KPI Filter Search page. |
View results for the KPIs that meet the criteria that is specified on the KPI Filter Search page. |
|
KPI Filter Criteria |
BC_KPI_OBJ_SRCH |
Click either Save Filter or Delete filter on the KPI Filter Search page. |
Save KPI search criteria to a specified name or delete a named search. |
|
Search for Single KPI, Single Dimension Member |
KP_QUERY_SEARCH |
|
Enter criteria to view results of a single KPI dimension member over multiple time periods. Results are displayed using the KPI Detail page. |
|
KPI Detail |
BCIC_KPIDETAI3_PNL |
Click a KPI dimension member description from various pages, such as the KPI List page. |
View assessment details for a KPI for current, cumulative, and prior year time frames. |
|
KPI Detail - Additional Detail |
BC_KPIDETAIL_3 |
On the KPI Detail page, select the Additional Detail tab. |
View target rules, notes, and other KPI-related fields. |
|
KPI Detail - Strategy Map |
BC_CAUSE_EFF_IMG |
On the KPI Detail page, select the KPI Strategy Map tab. |
View the assigned strategy map image for a KPI. This page is available only if an associated strategy map exists. |
|
Select KPIs for Chart |
BC_PORT_SELECT_KPI |
On the Portfolio KPI Analysis page, click Select New KPIs for Chart. |
Select different KPIs to chart on the Portfolio KPI Analysis page. |
|
Search for My KPIs |
KP_KPILIST_FILTER |
|
Enter criteria for viewing KPIs for which you have been identified as either the owner or associate owner. |
|
My KPIs |
KP_KPILIST_OWNER |
From the Search for My KPIs page, click Search. |
Review the KPIs that you have been assigned to as either the owner or associate owner for a specified business unit, scenario, fiscal year, and accounting period. |
|
Portfolios |
BC_PORT_SRCHPNL |
|
View a list of defined portfolios and select one to view its details. |
|
Portfolio KPI Analysis |
BC_PORT_ANALYSIS |
From the Portfolios page, click the KPIs link for a portfolio. |
View the KPIs within a selected portfolio. |
|
Portfolio KPI Analysis - Select New KPI Search Criteria |
BC_PORTKPI_FILTER |
On the Portfolio KPI Analysis page, click Switch KPI Period. |
Specify the business unit, scenario, year, and period to evaluate when viewing the Portfolio KPI Analysis page |
|
KPI Cause and Effect |
BC_VW_KPI_CS_EFF |
On the KPI Detail page, click Cause and Effect. |
View the cause and effect relationships for the current KPI. This page shows other KPI dimension members that affect the current KPI, or those that are affected by the current KPI. |
|
KPI Compare Selection List |
BC_KPI_SELECT_LIST |
From the KPI Detail page, click the Compare KPIs link. |
Select KPIs to compare graphically. |
|
KPI Compare |
BC_KPI_COMP_CHARTS |
From the KPI Compare Selection List page, click the Generate Charts button. |
View a graphical comparison of several KPIs. |
|
KPI Analysis - Search |
BC_PE_CKPI_ANLY_C1 |
|
Specify criteria for KPI analysis. |
|
KPI Analysis |
BC_PE_CKPI_ANLY_1 |
On the KPI Analysis - Search page, click Search. |
Analyze KPIs and composite KPIs. |
|
KPI Analysis - Weighting |
BC_PE_CKPI_ANLY_2 |
Click the Weighting link on the KPI Analysis page. This link appears for composite KPIs only. |
Change the weighting for KPIs that make up a composite KPI to display new results on the KPI Analysis page. These results are not saved. |
|
Analyze |
BC_KP_PATH |
On the KPI Detail page, click Analyze. |
Select a KPI to view on the Analyze - KPI Tree page. |
|
Analyze - KPI Tree |
KP_ANALYZE_TREE |
On the Analyze page, click a tree description in the KPI Analysis Path grid. |
|
|
Hierarchical KPI Search |
KP_VIEW_NODE_KPI |
|
Enter criteria for which hierarchical KPIs to view. |
|
Hierarchical KPI |
KP_VIEW_NODE_KPI |
|
View assessment results for hierarchical KPIs by navigating through the KPI tree. |
KPI Filter Search Page
Use the KPI Filter Search page (BC_KPI_OBJ_FILTER) to view KPIs that meet specified criteria.
Image: KPI Filter Search page
This example illustrates the fields and controls on the KPI Filter Search page. You can find definitions for the fields and controls later on this page.
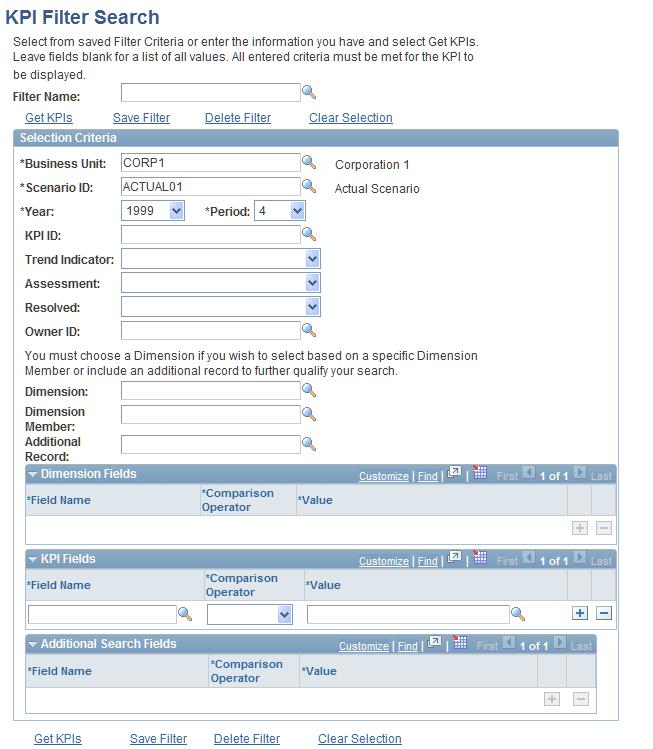
This page enables you to specify search criteria by which to view KPIs, save search criteria to a filter name, and retrieve a saved filter.
Actions
Selection Criteria
The remaining selection criteria fields are optional, and enable you to further limit which KPIs you view.
Selection Criteria - Dimension Fields
Use this grid to specify a dimension related field by which to further qualify your search. Select a dimension field, comparison operator and value. To use this option, you must first specify a value for the Dimension field.
Selection Criteria - KPI Fields
Use this grid to specify a KPI related field by which to further qualify your search. Select a KPI field, comparison operator, and value. To use this option, you must first specify a value for the Dimension field.
Selection Criteria - Additional Search Fields
Use this grid to specify an additional field by which to further qualify your search. Select a field, comparison operator, and value. To use this option, you must first specify a value for the Dimension field.
Viewing Results
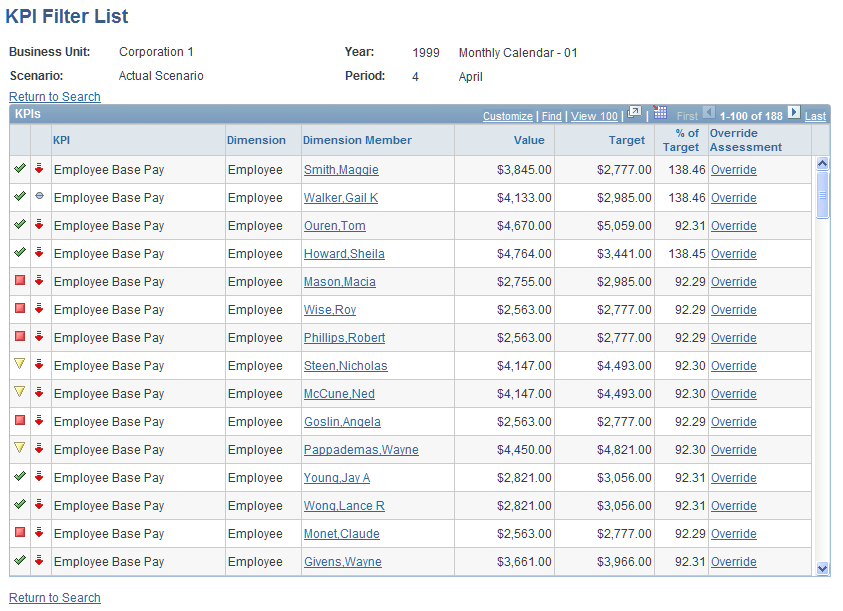
Click Get KPIs to view the KPIs that match your criteria, and access the KPI Filter List page.
Image: KPI Filter List page
This example illustrates the fields and controls on the KPI Filter List page. You can find definitions for the fields and controls later on this page.
KPI Detail Page
Use the KPI Detail page (BCIC_KPIDETAI3_PNL) to view assessment details for a KPI for current, cumulative, and prior year time frames.
Image: KPI Detail page
This example illustrates the fields and controls on the KPI Detail page. You can find definitions for the fields and controls later on this page.
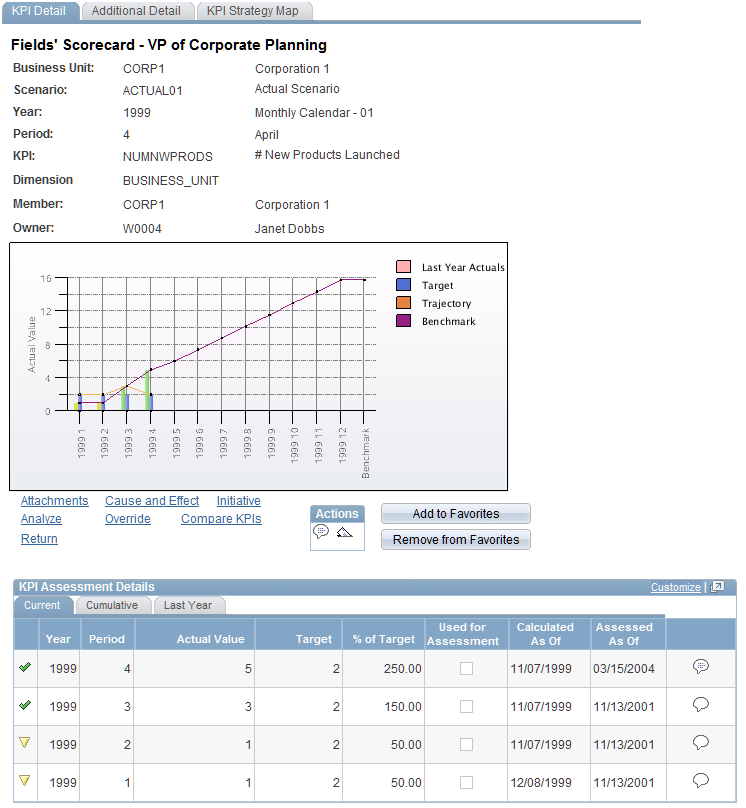
The bar chart shows the actual results, with line overlays of the percent of target over a period of time, last year's actual results, and the estimated results for future periods (trajectory) based on the current trends.
The hierarchy of the branch of scorecard strategy components to which this KPI is associated appears in the upper right. Click a description to view the strategy details page for a component. If you are not on a scorecard viewing page when you access the KPI Detail page, this hierarchy does not appear.
In the grid area, select a tab to review the current year's assessment results, cumulative assessment results, and last year's assessment results.
Select the Additional Detail tab to review target rules and other information about the KPI.
Select the KPI Strategy Map tab to view the cause and effect image map if one has been associated with the KPI.
KPI Compare Selection List Page
Use the KPI Compare Selection List page (BC_KPI_SELECT_LIST) to select KPIs to compare graphically.
Image: KPI Compare Selection List page
This example illustrates the fields and controls on the KPI Compare Selection List page. You can find definitions for the fields and controls later on this page.
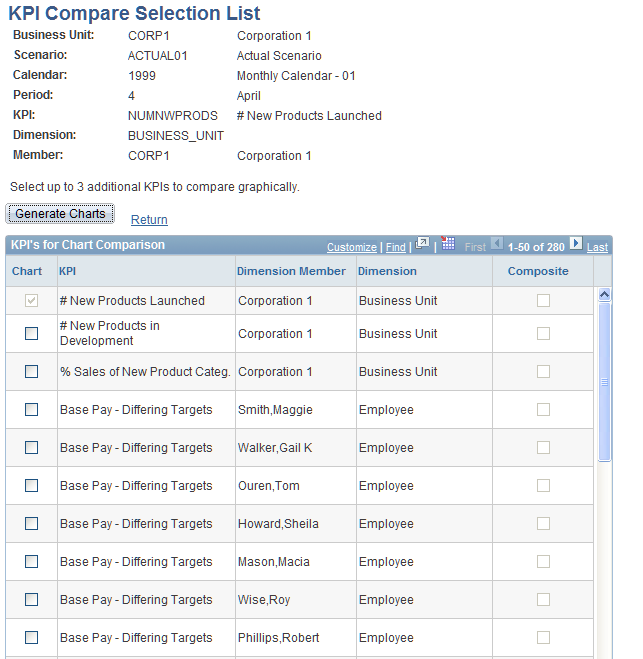
The grid contains a list of other KPIs and their dimension members. To graphically compare the current KPI with other KPIs, use the following options:
On the KPI Compare page, you can click a dimension member description to access the KPI Detail page for that KPI dimension member.
My KPIs Page
Use the My KPIs page (KP_KPILIST_OWNER) to review the KPIs that you have been assigned to as either the owner or associate owner for a specified business unit, scenario, fiscal year, and accounting period.
Image: My KPIs page
This example illustrates the fields and controls on the My KPIs page. You can find definitions for the fields and controls later on this page.
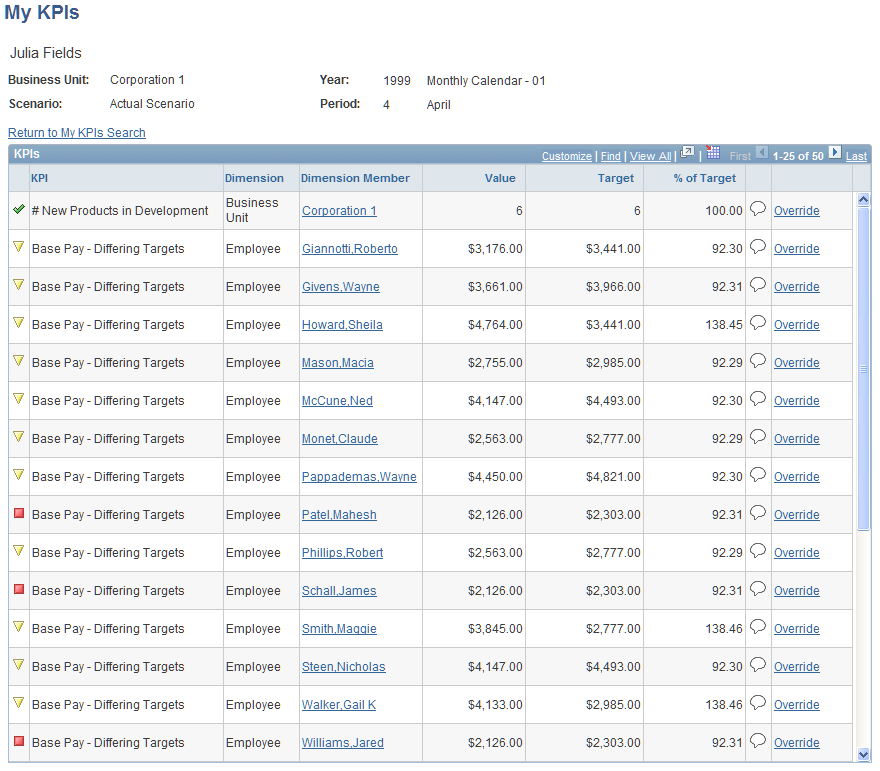
The following columns appear in the KPIs grid.
 ) or (
  )
)Portfolio KPI Analysis Page
Use the Portfolio KPI Analysis page (BC_PORT_ANALYSIS) to view the KPIs within a selected portfolio.
Image: Portfolio KPI Analysis page
This example illustrates the fields and controls on the Portfolio KPI Analysis page. You can find definitions for the fields and controls later on this page.
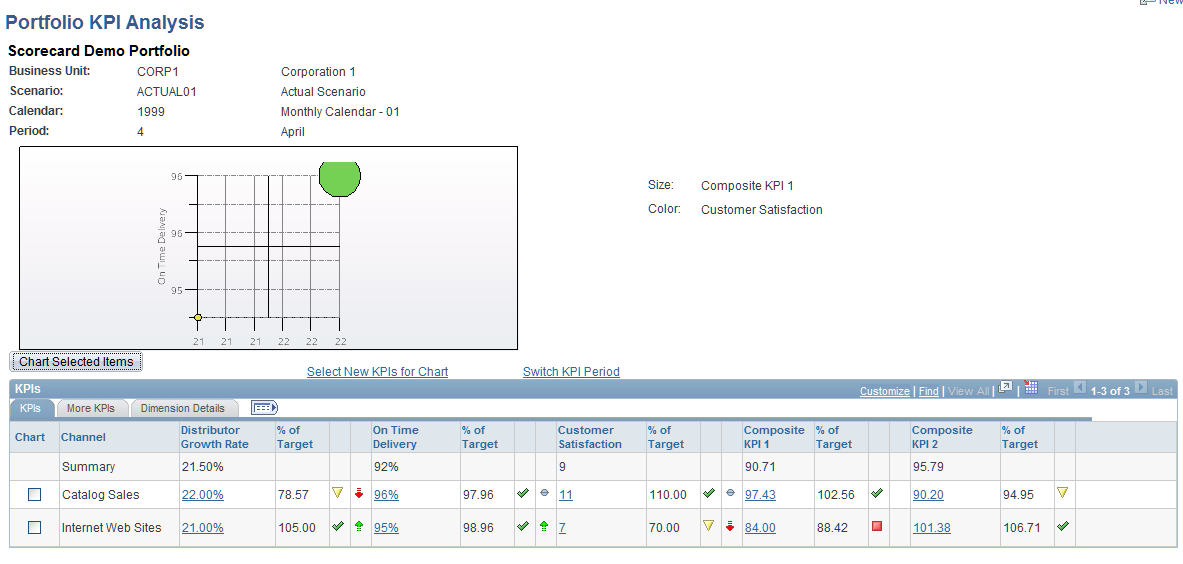
Bubble Chart
The bubble chart displays circles on the x and y axes for the KPIs that are selected on the Select KPIs for Chart page. Each axis is labelled with the KPI that it represents. You establish this chart's configuration on the Portfolio Definition - KPIs page.
Each "bubble" on the chart represents values for a different KPI dimension member. You can view the names (descriptions) by moving your mouse pointer over the bubbles.
The size and color of the bubbles is controlled by the KPIs that are selected on the Select KPIs for Chart page.
The colors that are displayed for the objects correspond to the assessment colors for the selected data, and the size of each bubble is related to the resolved value for the charted KPIs. The KPIs that are used for size and color are displayed next to the chart.
Actions
KPIs
The column labels in this grid vary according to selections made for the portfolio in the Portfolio Definition component. Each KPI in the portfolio appears as the label for one column, followed by columns for one or more of the following: % of target, assessment, trend, and any object attributes that are selected.
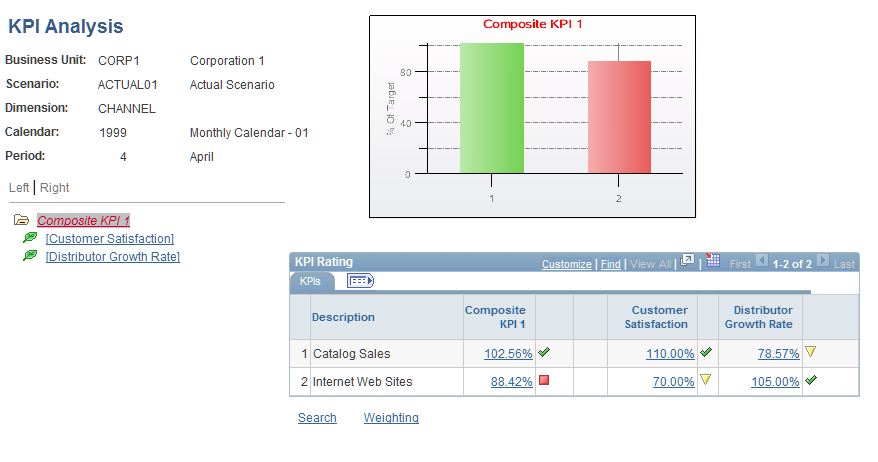
KPI Analysis Page
Use the KPI Analysis page (BC_PE_CKPI_ANLY_1) to analyze KPIs and composite KPIs.
Image: KPI Analysis page
This example illustrates the fields and controls on the KPI Analysis page. You can find definitions for the fields and controls later on this page.
 and
and 
KPI Rating
The grid is made up of the KPI dimension members and the percent of target that they achieved, the assessment image, and trend. If a composite KPI is selected, the grid will contain these same columns for each KPI that makes up the composite KPI.
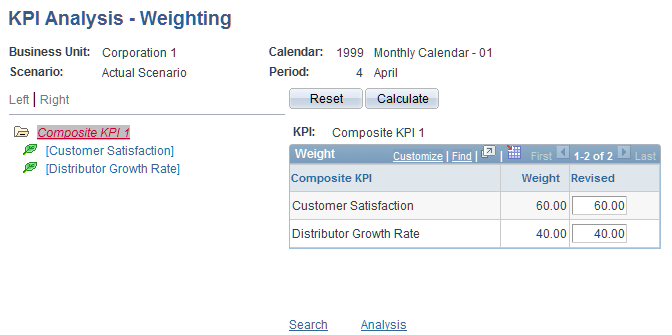
KPI Analysis - Weighting Page
Use the KPI Analysis - Weighting page (BC_PE_CKPI_ANLY_2) to change the weighting for KPIs that make up a composite KPI to display new results on the KPI Analysis page.
These results are not saved.
Click the Weighting link on the KPI Analysis page. This link appears for composite KPIs only.
Image: KPI Analysis - Weighting page
This example illustrates the fields and controls on the KPI Analysis - Weighting page. You can find definitions for the fields and controls later on this page.
 and
and 

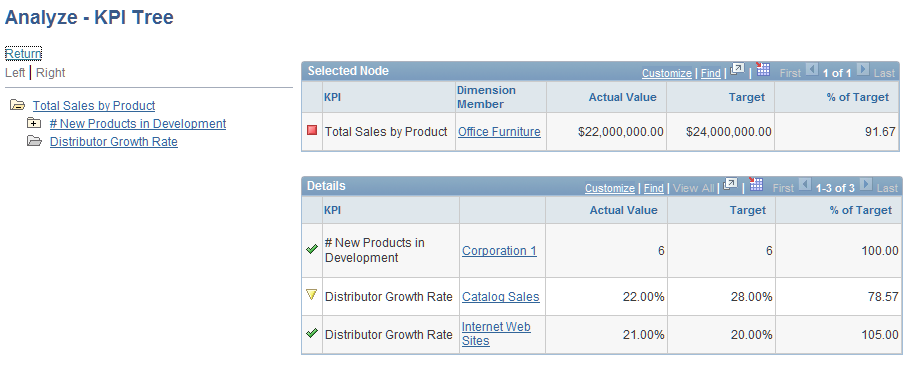
Analyze - KPI Tree Page
Use the Analyze - KPI Tree page (KP_ANALYZE_TREE) to navigate through the KPI analysis tree that is associated with a KPI.
Click Analyze on the KPI Detail Page. On the Analyze page, click a tree description in the KPI Analysis Path grid.
Image: Analyze − KPI Tree page
This example illustrates the fields and controls on the Analyze − KPI Tree page. You can find definitions for the fields and controls later on this page.
 and
and 
Hierarchical KPI Page
Use the Hierarchical KPI page (KP_VIEW_NODE_KPI) to view assessment results for hierarchical KPIs by navigating through the KPI tree.
Image: Hierarchical KPI page
This example illustrates the fields and controls on the Hierarchical KPI page. You can find definitions for the fields and controls later on this page.
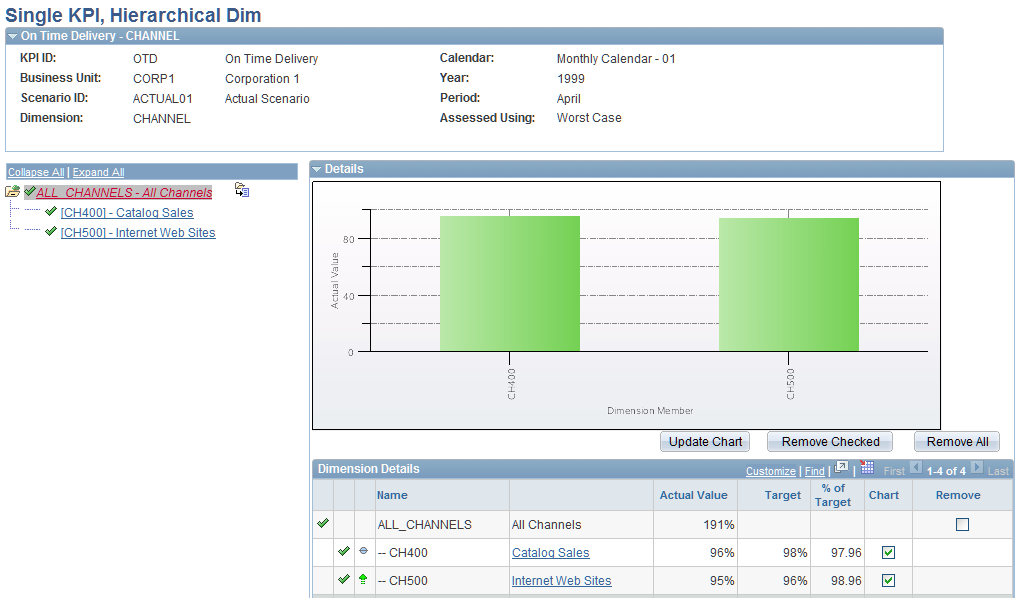
Tree Controls
The nodes of the dimension hierarchy tree for the KPI appear in the tree control area.
 and
and 

Details
Expand the Details group box to view details for the dimension tree nodes.
Initially, the information that appears in this group box is for only the selected node. The graph shows the actual values for the selected node, and the grid lists the assessment results, actual values, target values, and percent of target. If the node that is selected has children that are the detail dimension members, then the grid will also contain the KPI values for those dimensions members.