Viewing Scorecard Results
This topic discusses how to:
Review scorecard performance.
View strategy results.
View scorecard KPI results.
Review scorecard portfolios.
Review cause and effect relationships.
Review performance of strategic initiatives.
Note: On these pages, you can view only the KPI dimension members and scorecards to which you have been granted security.
Pages Used to View Scorecard Results
|
Page Name |
Definition Name |
Navigation |
Usage |
|---|---|---|---|
|
Scorecard at a Glance |
BC_HOMEPAGE |
|
View a summary of scorecard results. |
|
Strategy |
BC_STRATEGY_TREE |
|
View a scorecard's strategy components and their assessments hierarchically, and navigate through each level. At the most detailed level, you can view the scorecard's KPIs. |
|
Strategy Detail |
BCIC_STRATDET_PNL |
Click a strategy component Description field on various pages. |
View historical assessment results for a strategy component by period. |
|
Strategy Detail - Strategy Map |
BC_CAUSEEFF_IMG |
Select the Strategy Map tab on the Strategy Detail page. |
View the assigned strategy map image for a strategy component. |
|
Component Cause & Effect |
BC_VW_CAUSE_EFFECT |
Click the Cause and Effect link on the Strategy Detail page. |
View the cause and effect relationships for the current strategy component. This page shows other components that affect the current strategy component, or those that it affects. |
|
Strategies by Perspective |
BCIC_VW_BY_PERS |
|
View strategy components categorized by their perspective. |
|
Portfolios |
BC_PORT_SRCHPNL |
|
View a list of defined portfolios and select one to view its details. |
|
Portfolio Scorecard Analysis |
BC_VIEW_PORTFOLIO |
From the Portfolios page, click the Scorecards link for a portfolio. |
View the scorecards within a selected portfolio. Click an assessment to transfer to that scorecard. |
|
Strategic Thrusts |
BC_SRCHDETAIL |
|
View assessment results for strategic thrusts. |
|
Strategic Thrusts Detail |
BC_VIEW_DETAIL |
On the Strategic Thrusts page, click a strategy component description. |
View assessments for each object that is associated with a strategic thrust, grouped by the critical success factor with which it belongs. |
|
KPI List |
BCIC_KPILIST_PNL |
|
View a list of the scorecard's KPIs. View a bar, trend, or variance chart of KPIs. |
|
KPI List - Related KPIs |
BCIC_KPIREL_PNL |
|
View KPIs that are related to the current scorecard. |
|
Initiative |
BC_VW_KPI_INITS |
From the KPI Detail page or Strategy Detail page, click the Initiative link. |
View strategic initiatives that are associated with a strategy component or KPI. |
Common Elements Used in This Topic
Scorecard at a Glance Page
Image: Scorecard at a Glance page
This example illustrates the fields and controls on the Scorecard at a Glance page. You can find definitions for the fields and controls later on this page.
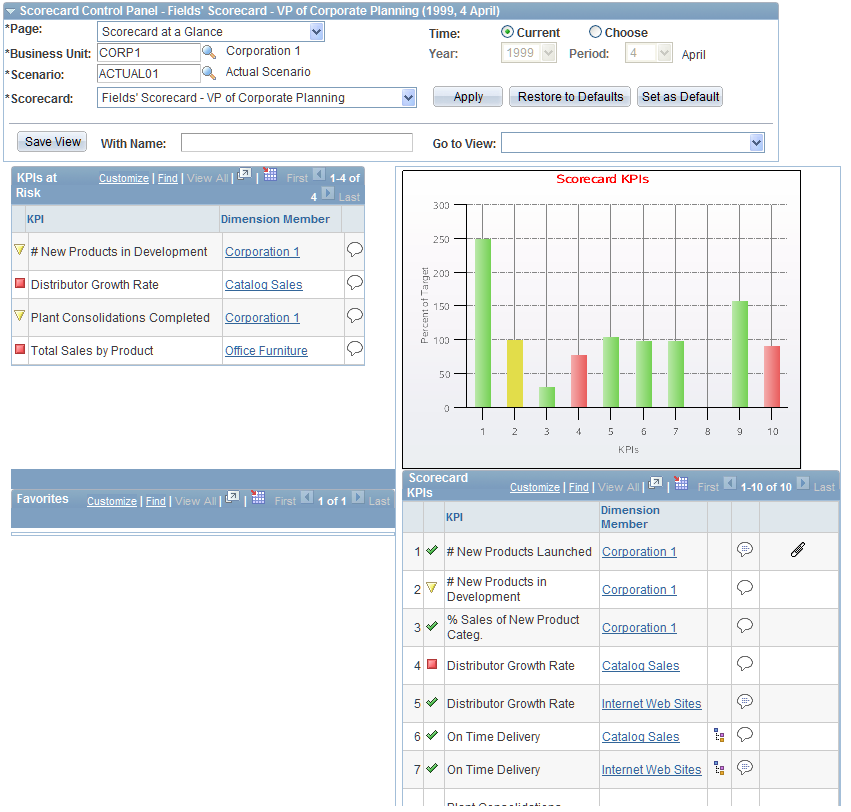
Scorecard Control Panel
These fields are discussed in the Common Elements topic.
KPIs at Risk
This grid lists KPIs that received assessments that aren't meeting acceptable levels of performance. You designate the assessments that are considered to be exceptions by using the Treat as Risks grid on the Scorecard page.
Favorites
The Favorites grid shows the assessments for the KPIs or strategy components that you've chosen as favorites. This grid includes KPIs or strategy components from all scorecards, not just the scorecard that is currently selected.
Scorecard KPIs
This group box includes a graph that shows the results of the KPIs for this scorecard and a grid that shows the assessments for the current scorecard's KPIs.
Strategy Page
Use the Strategy page (BC_STRATEGY_TREE) to view a scorecard's strategy components and their assessments hierarchically, and navigate through each level.
At the most detailed level, you can view the scorecard's KPIs.
Image: Strategy page
This example illustrates the fields and controls on the Strategy page. You can find definitions for the fields and controls later on this page.
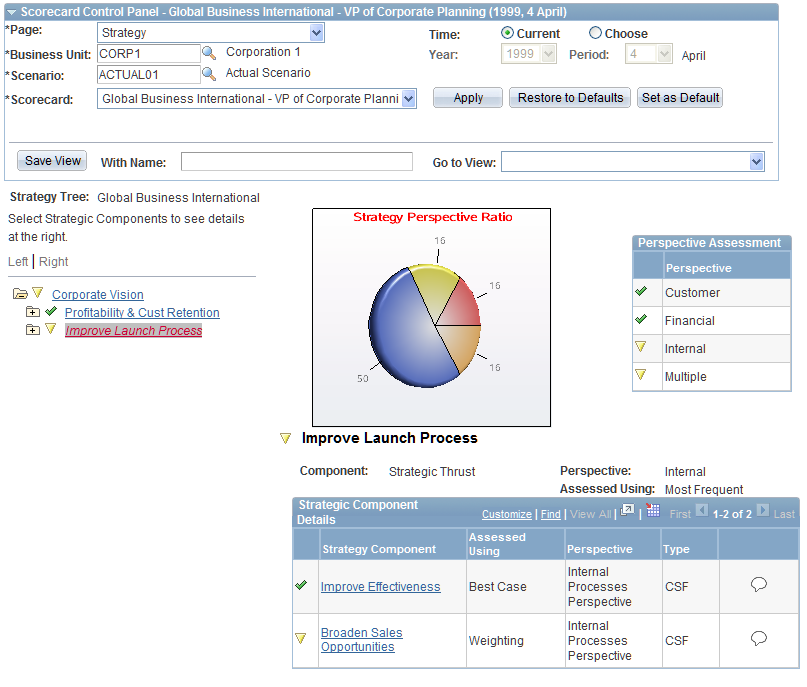
Image: Strategy page
This example illustrates the fields and controls on the Strategy page. You can find definitions for the fields and controls later on this page.
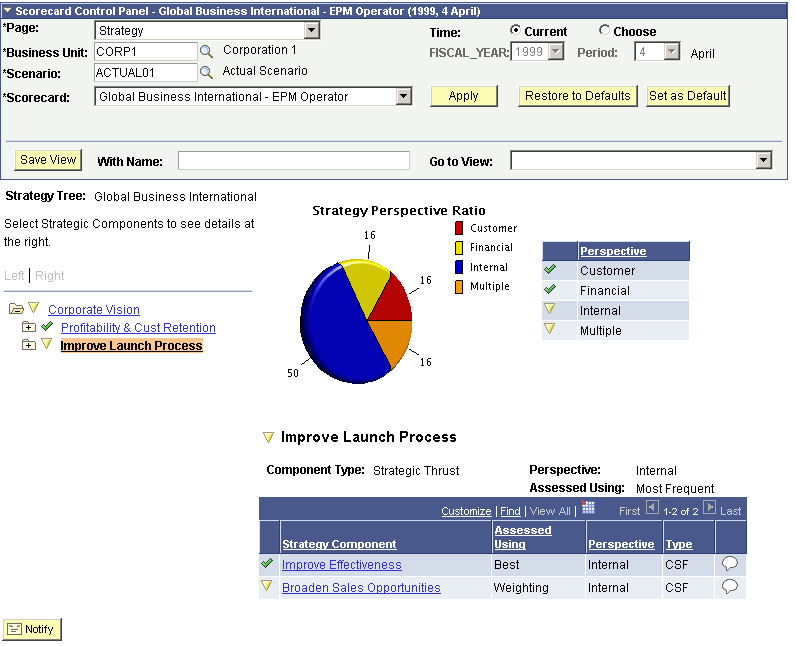
This page shows the strategy tree hierarchy on the left, with assessment information for the components that are subordinate to the currently selected component (the active strategy component) in the grid area below the graph. When you initially view this page, the vision-level component is active.
You can interact with this page by:
Selecting different components in the tree to review assessment information for that level of the strategy hierarchy in the grid area.
Expanding or collapsing branches of the tree by clicking the tree node folders.
You can expand the tree to the KPI level (KPIs appear with a key symbol). An X image appears in the tree for any strategy components that are not assessed. This could occur if a branch is made up entirely of monitor-only KPIs, for example.
Clicking a component's description (or a KPI's dimension) within the grid area to access the related detail page, where you can review more information.
Reviewing the assessment for each perspective .
Changing the results that you are viewing by modifying the field values in the scorecard control panel.
The graph that appears varies depending on the level of the strategy tree that you select. At the highest level (the vision level), a pie chart shows the percentage of components within each perspective, and the grid breaks down the assessments by perspective category. At lower levels, a bar chart shows the percentage of target achieved for the dimension members within that level.
KPI List Page
Use the KPI List page (BCIC_KPILIST_PNL) to view a list of the scorecard's KPIs.
View a bar, trend, or variance chart of KPIs.
Image: KPI List page
This example illustrates the fields and controls on the KPI List page. You can find definitions for the fields and controls later on this page.
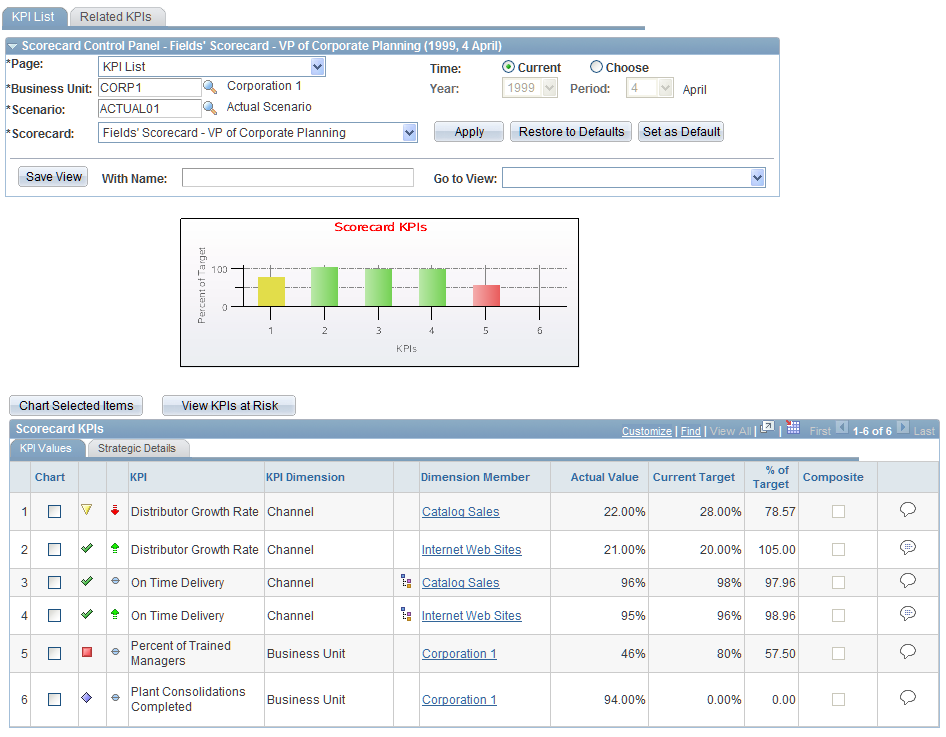
Scorecard Control Panel
These fields are discussed in the Common Elements topic.
Scorecard KPIs
A graph and grid of the scorecard results appears in this section. When you first access this page, all of the scorecard KPIs that you have been granted security to access are included in the graph and appear within the grid area. Use the following buttons to change the data that appears in the graph and grid.
The following fields appear as columns in the grid:
 )
) ) or (
  )
) )
)Portfolio Scorecard Analysis Page
Use the Portfolio Scorecard Analysis page (BC_VIEW_PORTFOLIO) to view the scorecards within a selected portfolio.
Click an assessment to transfer to that scorecard.
Image: Portfolio Scorecard Analysis page
This example illustrates the fields and controls on the Portfolio Scorecard Analysis page. You can find definitions for the fields and controls later on this page.
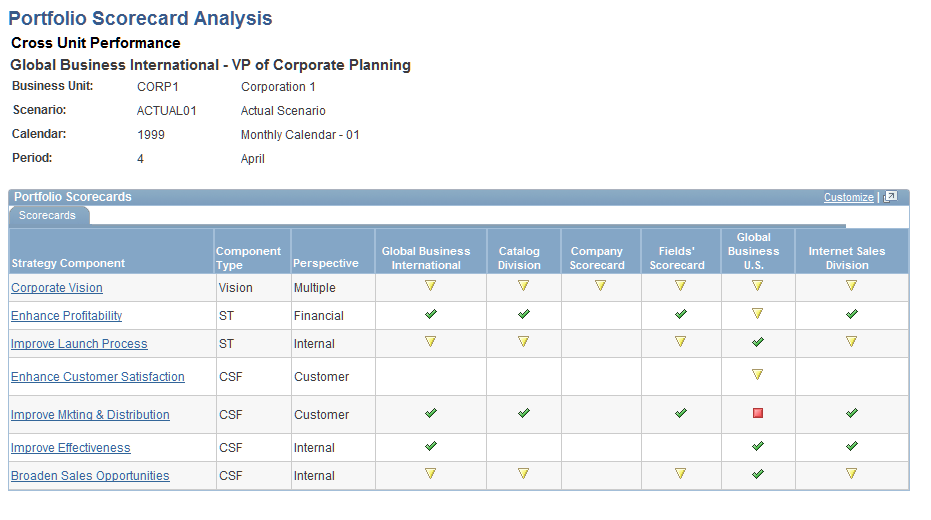
This page enables you to compare assessments across multiple scorecards at one time. This is especially valuable when you want to compare performance among departments, business units, or individuals, for example.
Component Cause & Effect Page
Use the Component Cause & Effect page (BC_VW_CAUSE_EFFECT) to view the cause and effect relationships for the current strategy component.
This page shows other components that affect the current strategy component, or those that it affects.
Click the Cause and Effect link on the Strategy Detail page or click the Cause and Effect link on the KPI Detail page
Image: KPI Cause and Effect page
This example illustrates the fields and controls on the KPI Cause and Effect page. You can find definitions for the fields and controls later on this page.
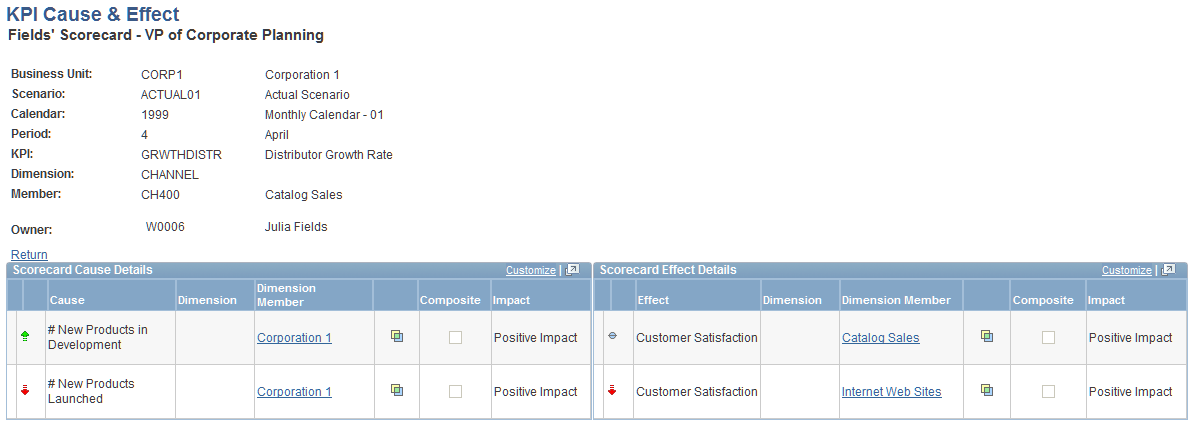
These pages show the components or KPI dimension members that the current component or KPI dimension member has an impact upon (those listed in the Cause column), or those that impact it (those listed in the Effect column).
This information is derived from the KPI Cause Effect page (or Component Cause Effect page) in the following manner:
Items listed in the Cause column are listed in the Cause Effect page for the current KPI (or component).
Items listed in the Effect column will contain the current KPI (or component) in their Cause Effect page.

Initiative Page
Use the Initiative page (BC_VW_KPI_INITS) to view strategic initiatives that are associated with a strategy component or KPI.
Image: Initiative page
This example illustrates the fields and controls on the Initiative page. You can find definitions for the fields and controls later on this page.
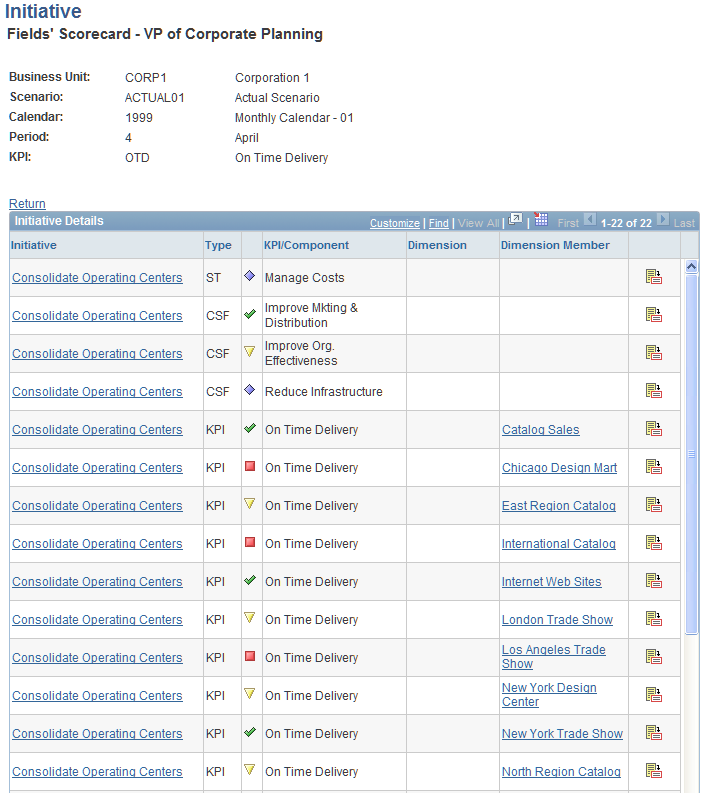
The grid lists the components and KPI dimension members that are part of the strategic initiative, and their assessment results.
