Understanding Portfolios
This topic discusses:
Scorecard portfolios.
Key performance indicator (KPI) portfolios.
Portfolio strategy component ranking.
Portfolios enable you to group related KPIs or scorecards for the purpose of comparing them. Portfolios are similar in concept to stock portfolios; in much the same way that an investor compares the relative performance of individual investments in her investment portfolio, users group KPIs or scorecards into a portfolio to be able to compare and contrast them. For example, a manager can define a portfolio that includes the scorecards of each of his direct reports to gauge how the entire team is doing, or a project manager can define a portfolio that comprises KPIs that measure various metrics important to project management.
A portfolio can include either scorecards or KPIs, or both. The system provides several pages for viewing portfolios: the Portfolio KPI Analysis page for KPI portfolios, the Portfolio Scorecard Analysis page for scorecard portfolios. The options that you establish when you define a portfolio control the information that appears on the portfolio view pages.
Scorecard Portfolios
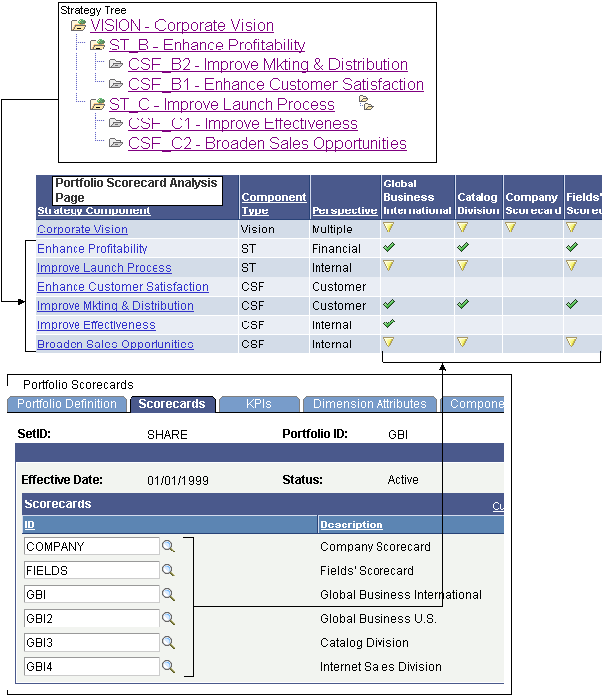
When you set up a scorecard portfolio, you specify which strategy tree it is based on and which scorecards it includes. When you view the portfolio, the portfolio strategy tree components appear as the rows on the grid, and each scorecard is listed as a column on the grid. The cells within the grid show the assessment results for that strategy component and scorecard. This provides you with an overview of how well each scorecard meets the strategic goals.
If the scorecard doesn't use the same strategy tree as that of the portfolio, then the intersecting cell for any portfolio strategy component that is not part of that particular scorecard will be blank.
This diagram shows how the portfolio strategy tree and the portfolio's scorecards appear in the grid of the Portfolio Scorecard Analysis page:
Image: How strategy tree and scorecards are used to generate the Portfolio Scorecard Analysis page grid
How strategy tree and scorecards are used to generate the Portfolio Scorecard Analysis page grid
Scorecard Portfolio Setup Steps
To set up a scorecard portfolio, complete these steps:
Specify a name, description, and strategy tree for the portfolio.
Specify which scorecards to include.
(Optional) Rank the portfolio's strategy components and calculate their scores.
KPI Portfolios
KPI portfolios enable you to group KPIs of the same dimension to compare and contrast their assessment results. The KPIs must all be from the same dimension. KPI portfolios can include composite and standard KPIs.
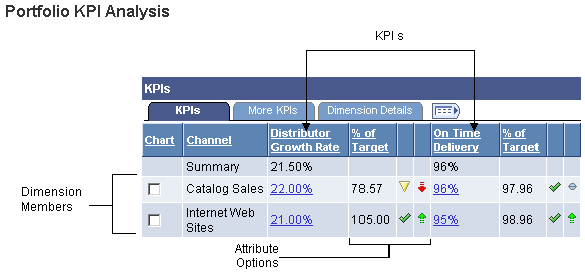
When you view a KPI portfolio, the grid displays the portfolio's KPIs as the columns of the grid, and the portfolio's KPI dimension members as the rows of the grid. This provides you with an overview of how well each KPI dimension member is performing for each KPI. For each KPI, you can choose whether to display any of the following attributes in the columns next to that KPI: percent of target, assessment results, or trend. The KPI Portfolio Analysis page also includes a bubble chart that plots the data of KPIs that you specify as the x-axis, y-axis, and z-axis (bubble size), and bubble color values.
This diagram shows how these parameters appear in the grid of the Portfolio KPI Analysis page:
Image: Portfolio KPI Analysis grid
Portfolio KPI Analysis grid
KPI Portfolio Setup Steps
To set up a KPI portfolio, complete these steps:
Specify a name, description, and tree for the portfolio.
Specify which KPIs to include, how to summarize each KPI, which attributes to show for each KPI, and which KPIs to use as chart data.
The KPIs must all be the same dimension type. After you select the first KPI, the system limits additional selections to only KPIs that use the same dimension.
Specify which dimension members to include, using one of these methods:
Select each dimension member from a list.
Define a rule that retrieves the dimension members.
Use the Dim Member Select (dimension member selection) page to define the rule.
(Optional) Select additional data from the dimension to appear on the Portfolio KPI Analysis page.
For example, if the KPI portfolio is based on the project dimension, you could include the project start date, project end date, and project owner fields.
(Optional) Rank the portfolio's strategy components and calculate their scores.
Portfolio Strategy Component Ranking
You can rank a portfolio's strategy components against each other to determine a score that indicates the relative weight of each component. These scores are used in some PeopleSoft applications that are scorecard-based, such as PeopleSoft Project Portfolio Management. You rank each component by completing a grid. Rankings can be relative, absolute, or a mixture of both.
Relative rankings compare components to each other. The system automatically assigns the opposite rank to the compared component. For example, if you rank component A HIGH when compared to component B, then the system would automatically set the rank for component B to LOW when being compared to component A, assuming LOW was established as the opposite rank of HIGH.
Absolute ranking uses a scale such as A, B, C, D to rank components independently.
Before you can rank components you need to set up the rankings and define their numeric value. You also need to define an opposite for any rankings that are used as relative ranks.