Understanding the Data Load Analysis Dashboard
Accurate reporting on your organization's data is completely dependent on the validity of data stored in Multidimensional Warehouse (MDW) tables; if incomplete or incorrect data resides in these tables, reporting and analysis can be flawed. Given the considerable dependence on data in MDW tables, all source data entering EPM is validated within ETL jobs. Additionally, specific ETL jobs capture job statistic and error data (for example, source row count versus target insert row count). The summarized validation, job statistic, and error data is stored in specific MDW target tables.
See Understanding Data Validation and Error Handling in the ETL Process.
The Data Load Analysis dashboard provides user-friendly reports built on top of the MDW tables with summarized error data and helps you analyze job run statistics data and quickly identify specific data failing validation.
The Data Load Analysis dashboard reports can help answer:
Which jobs had data load issues that caused missing data?
Which jobs had data loaded to error tables?
What source data failed the lookup validation and the related lookup table?
What is the job status and job statistics for each run?
Which jobs completed with a "Failed" status (for a specific time interval)?
Which jobs completed with a "Success" status (for a specific time interval)?
Which jobs completed with a "Success with Error Rows" or "Success with Data Mismatch" status (for a specific time interval)?
How many errors were encountered for each job in its last run, for a particular error table?
How many rows failed for the missing lookup value for each job, for a particular error table?
Which jobs completed with a "Warning" status (for a specific time interval)?
How is dimension and fact table growth trending for a specific EPM warehouse (over a specific time interval)?
The new Data Load Analysis dashboard contains the following pages:
Error Table Reports
Job Run Statistics
Dashboard and Report Prompts
The Fusion Campus Solutions Intelligence application provides dashboard and report prompts, which enable you to filter dashboard results and enhance data analysis. A dashboard prompt is a filter that affects all the content displayed on a dashboard page. A dashboard prompt with multiple columns can be used to further filter your subsequent selections. For example, if one column filters on a region, and the next column filters on districts, the district column can be constrained to show only districts in the region you select.
A report prompt provides general filtering of a column within a report. A report prompt can present all choices for a column, or, like a dashboard prompt, it can present constrained choices for a column. For example, if a request contains a Region = East filter, constraining choices for the City column restricts the selections to cities in the East region only. This eliminates the selection of a mutually exclusive filter that could result in no data.
Drilldown Feature for Error Table Page Reports
The reports in the Error Table page enable you to drill down from summarized error information to individual error details, such as source table columns and lookup table columns.
The reports in the Error Table page provide the following drill down levels and error details:
Level one provides error details up to job run time and total error count.
(This is the main report page level).
Level two provides drill down to lookup table and error row count per lookup table.
Level three provides drill down to lookup columns, error data and source columns, and error row count.
Level four is the last level and provides error details down to error SID.
Note: Every time you drill down a level, the corresponding error count is also summarized accordingly.
Using this feature you can quickly and easily pinpoint specific error data, such as individual failed source columns and related error table, error ID, lookup columns, target table, and so forth.
The following sections provide an example of the Error Table reports drill down feature.
Level One Error Table Report
Level one Error Table report provides error details up to job run time and total error count.
Image: Level one Error Table report
This example illustrates the fields and controls on the Level one Error Table report. You can find definitions for the fields and controls later on this page.
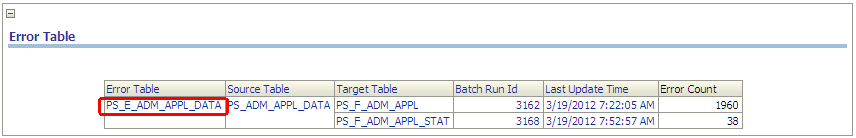
From here you can drill down on the Error Table, Source Table, Target Table, Batch Run ID, or Last Update Time fields.
For this example, assume you drill down on the PS_E_ADM_APPL_DATA error table.
Level Two Error Table Report
Level two Error Table report provides drill down details to source table, target table, Batch Run ID and error row count per lookup table.
Image: Level two Error Table report
This example illustrates the fields and controls on the Level two Error Table report. You can find definitions for the fields and controls later on this page.
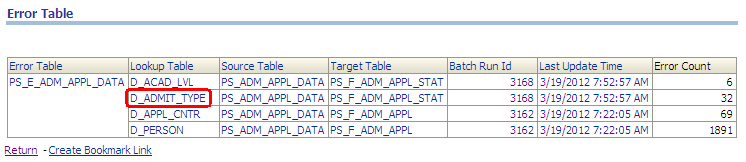
From here you can drill down on the Error Table, Lookup Table, Source Table, Target Table, Batch Run ID, or Last Update Time fields.
For this example, assume you drill down on the D_ADMIT_TYPE lookup table.
Level Three Error Table Report
Level three provides drill down details to source columns, lookup columns, source table, target table, batch run ID, and last update time, per failed source column data.
Image: Level three Error Table report
This example illustrates the fields and controls on the Level three Error Table report. You can find definitions for the fields and controls later on this page.
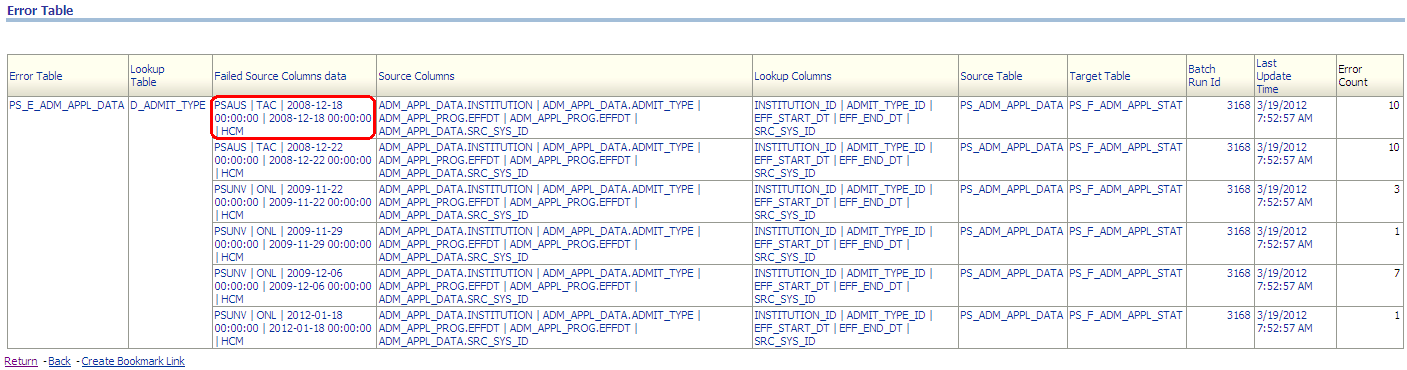
From here you can drill down on the Error Table, Lookup Table, Failed Source Columns Data, Lookup Columns, Source Table, Target Table, Batch Run ID, or Last Update Time fields.
For this example, assume you drill down on the failed source column data PSAUS | TAC | 2008–12–18.
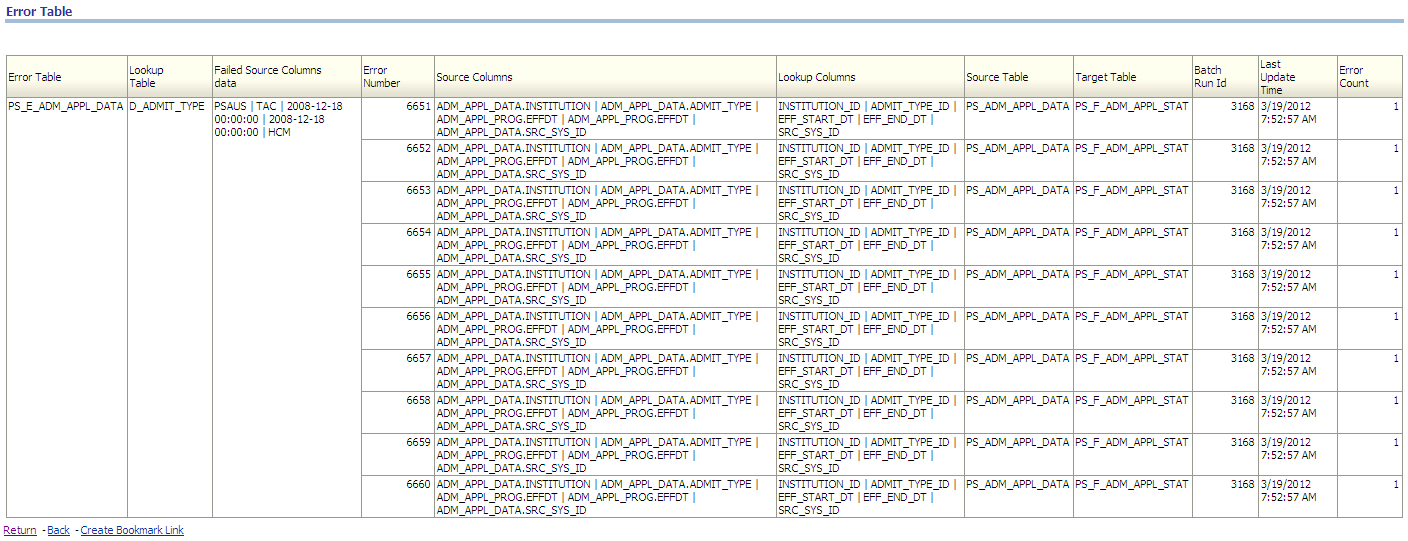
Level Four Error Table Report
Level four is the last level of drill detail and provides error details down to error number, error SID, lookup columns, and so forth.
Image: Level four Error Table report
This example illustrates the fields and controls on the Level four Error Table report. You can find definitions for the fields and controls later on this page.