6 Monitoring the LTFS-LE System
This chapter describes how to use the LTFS-LE BUI Dashboard to monitor the LTFS-LE system.The following topics are included:
Dashboard Overview
The LTFS-LE BUI includes the Dashboard, used to monitor LTFS-LE library, drive, and volume capacity along with LTFS-LE event logs.
To view the Dashboard, click the Dashboard tab in the LTFS-LE BUI.
Note:
When you launch the LTFS-LE BUI, the Dashboard page is displayed by default.The following figure shows the Dashboard:
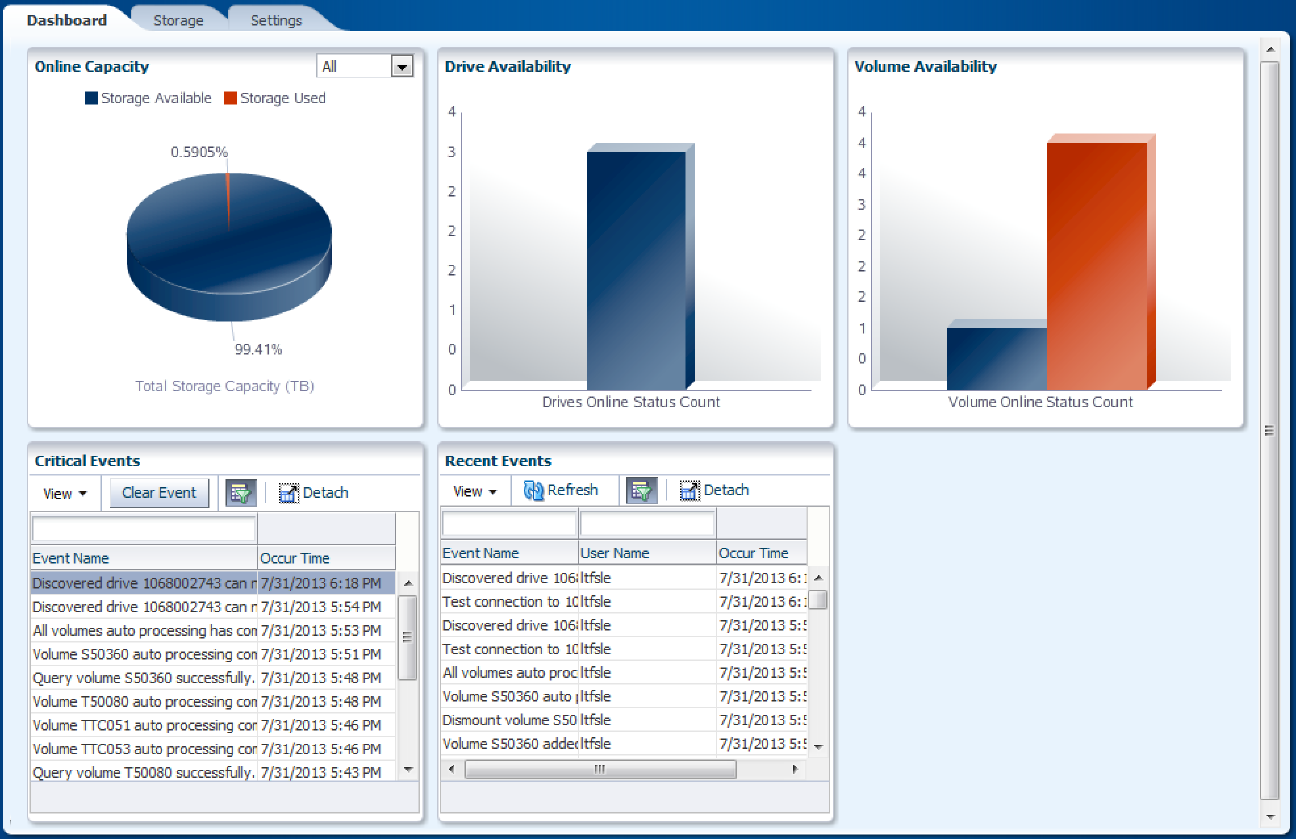
As shown in Figure 6-1, the Dashboard consists of the following panes:
-
Online Capacity
-
Drive Availability
-
Volume Availability
-
Critical Events
-
Recent Events
Monitoring Online Capacity
The following figure shows the Online Capacity pane included on the LTFS-LE Dashboard page:

As shown in Figure 6-2, the Online Capacity pane displays a pie chart indicating the following information:
-
Storage Available (displayed in blue)
The percentage of volume storage that is currently unused and available for LTFS-LE data storage. Place your mouse over this region of the chart to display the value in actual Terabytes (TB).
-
Storage Used (displayed in red)
The percentage of volume storage that is currently used. Place your mouse over this region of the chart to display the value in actual Terabytes (TB).
By default, the chart displays volume information for ALL volumes in the LTFS-LE library, regardless of media type.
If you want to adjust the chart to display volume information for a specific media type, click the menu in the upper right corner of the panel and select one of the following media types:
-
LTO-1.5T (Oracle's StorageTek 1.5 Terabyte LTO cartridge)
-
LTO-2.5T (Oracle's StorageTek 2.5 Terabyte LTO cartridge)
-
LTO-6.4T (Oracle's StorageTek 6.4 Terabyte LTO cartridge)
-
T10000T2:
-
Oracle's StorageTek 5 Terabyte T10000 cartridge formatted with a T10000C tape drive
-
Oracle's StorageTek 8 Terabyte T10000 cartridge formatted with a T10000D tape drive
-
Monitoring Drive Availability
The following figure shows the Drive Availability pane included on the LTFS-LE Dashboard page:
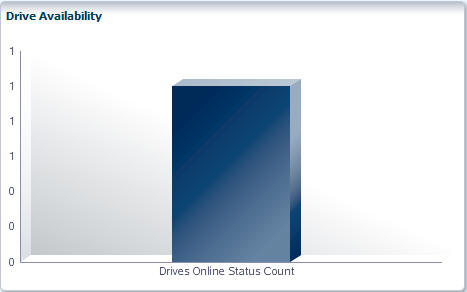
As shown in Figure 6-3, The Drive Availability pane includes a bar graph indicating the number of drives that are online and offline.
-
The Drives Online Status Count is displayed in blue.
-
The Drives Offline Status Count is displayed in red.
Note:
This graph only accounts for drives that are assigned to LTFS-LE. If a drive is not assigned to LTFS-LE, it is not included in the Drives Offline Status Count.Monitoring Volume Availability
The following figure shows the Volume Availability pane included on the LTFS-LE Dashboard page:
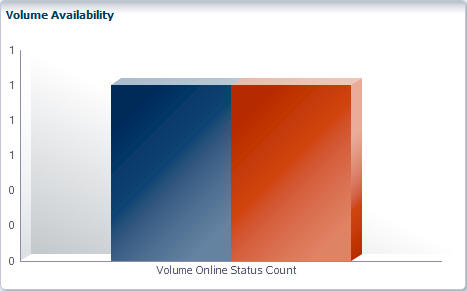
As shown in Figure 6-4, the Volume Availability pane includes a bar graph indicating the number of LTFS-LE volumes that are online or offline.
-
The Volumes Online Status Count is displayed in blue.
-
The Volumes Offline Status Count is displayed in red.
Note:
This graph only accounts for volumes that are assigned to LTFS-LE. If a volume is not assigned to LTFS-LE, it is not included in the Volume Offline Status Count.
Monitoring Critical Events
The LTFS-LE BUI Critical Events pane enables you to monitor critical LTFS-LE events that may require immediate user interaction with the system. These may be LTFS-LE system events, drive events, or volume events, and may include important error conditions.
The following figure shows the Critical Events pane:
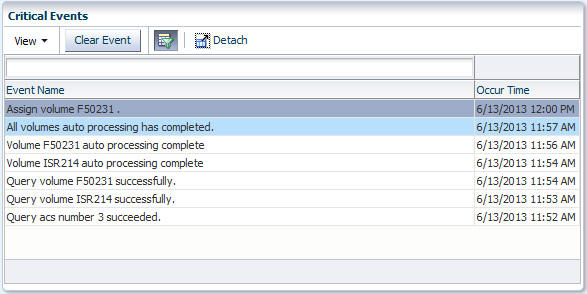
As shown in Figure 6-5, the Critical Events pane lists significant LTFS-LE system events and indicates when they occurred.
Events Listed
The Critical Events pane lists the following types of events:
Critical LTFS-LE System Events
You can view the following types of general LTFS-LE drive events:
-
LTFS-LE server warnings
-
LTFS-LE server failures
-
LTFS-LE server shutdowns
-
LTFS-LE server reboots
-
LTFS-LE job failures
-
LTFS-LE connectivity problems
You can view the following types of LTFS-LE drive events:
-
Drives added to the LTFS-LE
-
Drives removed from the LTFS-LE
-
Incompatible drives added to the LTFS-LE
-
Updates to drive assignments
-
Unexpected loss of connectivity with drives
You can view the following types of LTFS-LE volume events:
-
Volumes added to the LTFS-LE
-
Incompatible volumes added to the LTFS-LE
-
Unformatted volumes added to the LTFS-LE
-
Updates to volume assignments
-
Volume pool assignment issues
-
Warning for volume pool capacity watermarks
-
Warning for volume pool capacity limit
-
Volume incompatibility warnings
Editing the Critical Events Listing
Use the following controls to edit the Critical Events listing:
Use the View drop-down menu to customize the current listing. Click this menu and select one of the following:
-
Columns
Select Show All to display all columns, or select a specific column to show or hide it from the display.
-
Detach
Opens the panel in a separate window. You can also click the Detach icon to perform this action.
-
Reorder columns
Opens a dialog box you can use to specify the order in which the various columns appear.
-
Query by Example
Displays query fields above each column in the listing. Use these fields to filter the listing.
Select an event and click the Clear Event button to manually remove the event from the listing. For example, if you intentionally removed a drive from the LTFS-LE for repair, you may choose to clear the event from the listing.
By default, events are automatically cleared when issues are resolved. Events that are not cleared remain in the listing for 30 days.
Click the Query by Example icon to show or hide the empty query field above the Event Name column in the listing. You can enter a value in this field and press Enter to filter the listing. This field is visible by default.
Click Detach to display this panel in a separate window.
Monitoring Recent Events
The LTFS-LE BUI Recent Events pane enables you to monitor recent LTFS-LE activity, including general LTFS-LE events, drive events, and volume events.
The following figure shows the Recent Events pane:
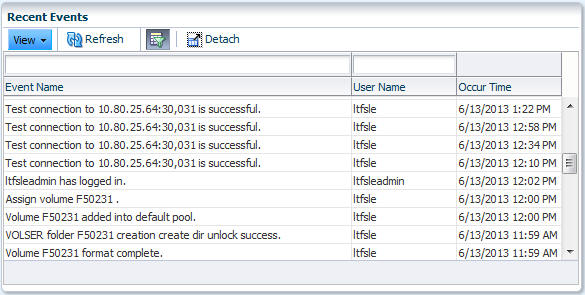
As shown in Figure 6-6, the Recent Events Dashboard panel lists both LTFS-LE and user-initiated events. For each event, this listing indicates the associated user and the time when the event occurred.
Events Listed
The Recent Events pane lists the following types of events:
General Events
You can view the following types of general LTFS-LE events:
-
All critical events
-
Session login and logoff details
-
Updates to LTFS-LE system settings
-
LTFS-LE server shutdowns
-
LTFS-LE server reboots
-
Completion of scheduled jobs
Editing the Recent Events Listing
Use the following controls to edit the Recent Events listing:
Use the View drop-down menu to customize the current listing. Click this menu and select one of the following:
-
Columns
Select Show All to display all columns, or select a specific column to show or hide it from the display.
-
Detach
Opens the panel in a separate window. You can also click the Detach icon to perform this action.
-
Reorder columns
Opens a dialog box you can use to specify the order in which the various columns appear.
-
Query by Example
Displays query fields above each column in the listing. Use these fields to filter the listing.
Click the Refresh button to reload the display.
Click the Query by Example icon to show or hide the empty display query fields above the Event Name and User Name columns in the listing. You can enter a value in these fields and press Enter to filter the listing. These fields are visible by default.
Click Detach to display this pane in a separate window.