C Troubleshooting
This appendix highlights the most common problems encountered when using RUEI, and offers solutions to locate and correct them. The information in this appendix should be reviewed before contacting Customer Support.
C.1 Oracle Web Sites
Information on a wide variety of topics is available from at the RUEI website (http://www.oracle.com/enterprise_manager/user-experience-management.html). It is recommended that you visit it regularly for support announcements.
In addition, detailed technical information is available via the Customer Support website (https://metalink.oracle.com). This includes information about service pack availability, FAQs, training material, tips and tricks, and the latest version of the product documentation.
C.2 Contacting Customer Support
If you experience problems with the use or operation of RUEI, you can contact Customer Support. However, before doing so, it is strongly recommended that you create a Helpdesk report file of your configuration. To do so, select System, Configuration, and then Helpdesk report. This file contains extended system information that is extremely useful to Customer Support when handling any issues that you report.
C.3 General (Non-specific) Problems
See the Troubleshooting chapter in the Oracle Real User Experience Insight Installation Guide.
If you are experiencing problems with the Reporter module, or find its interface unstable, it is recommended that you do the following:
-
Clear all caching within your browser, and re-start your browser.
-
Examine the error log. This is described in Section 15.7, "Working with the Event Log".
-
Reboot the system on which the Reporter is installed.
C.4 Starting Problems
If RUEI does not seem to start, or does not listen to the correct ports, do the following:
-
Review your network filter definitions. This is described in Section 13.4, "Defining Network Filters". In particular, ensure that no usual network filters have been applied. This is particularly important in the case of VLANs.
-
Ensure that RUEI is listening to the correct protocols and ports. This is described in Section 13.3, "Managing the Scope of Monitoring".
C.5 Delays in Reported Data
It is important to understand that there is a delay associated with the reporting of all monitored traffic. For information shown in the dashboard (so-called real-time data), this delay is 5 minutes. For most other data views (that is, session-based data), this delay is 15 minutes. However, there are two exceptions to this: the all page and the failed URL views. Both of these have delays of 5 minutes. It is important to understand the difference between real-time and session-based data when faced with small differences in what they are reporting. These are fully explained in Section 3.2.1, "Real-Time and Session-Based Data".
C.6 SNMP Alert Issues
If you are experiencing problems with your SNMP alerts (for example, they are not reaching the required users), it is recommended that you do the following:
-
Review thoroughly your SNMP notification settings. In particular, ensure that the manager address is correct, you have downloaded and implemented the required MIB definition, and that SNMP notification has been enabled. This is described in Section 15.3, "Configuring System Failure Alerts."
-
Check that you have downloaded and installed the latest version of the MIB file.
-
Check network connections as a receiver.
-
Check the configuration of your SNMP manager.
In addition, be aware that KPI names in SNMP alerts are specified in UTF-8, and not all SNMP managers fully support UTF-8. For further information, please review to your SNMP manager product documentation.
C.7 Text Message Alert Issues
If you are experiencing problems with your text message alerts, it is recommended that you do the following:
-
Review thoroughly your text message notification settings. This is described in Section 7.5.7, "Using Text Message Notifications" and Section 15.3, "Configuring System Failure Alerts".
-
Contact your text message provider for information about any reported issues.
-
Check that your modem is functioning correctly.
C.8 Time Zone Issues
If you are experiencing problems with reported times within the Reporter, you should ensure the required time zone is explicitly set in the [Date] section of the /etc/php.ini file. This is fully explained in the Oracle Real User Experience Insight Installation Guide. In addition, you should re-start the Apache web server (logged on as root) with the following command:
httpd -k restart
C.9 Data Monitoring Appears To Have Stopped
When monitoring very high levels of traffic, it can appear from the reported data that RUEI is no longer monitoring network traffic or it is delayed. An example of this is shown in Figure C-1.
Figure C-1 Drop in Reported Network Traffic
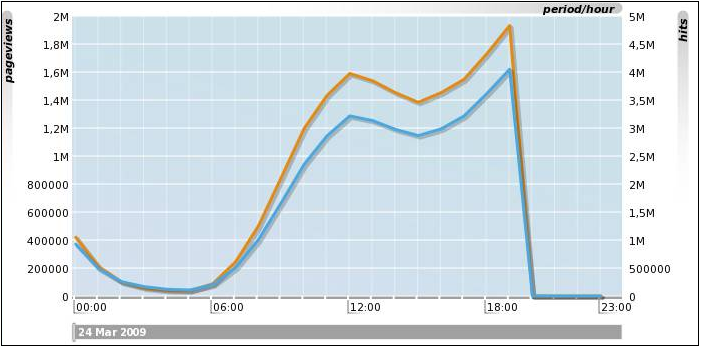
Description of "Figure C-1 Drop in Reported Network Traffic"
This report appears to show that network traffic stopped being monitored at 19:00. In fact, this situation is the result of an overloaded RUEI system. While traffic continues to be monitored, the generated Collector log files cannot be processed due to extremely high traffic levels and insufficient resources.
This can be confirmed by selecting System, then Maintenance, then Data processing, and then click the Performance tab. If the reported system load is approaching 100%, then the system is becoming overloaded. The use of this facility is fully described in Section 15.5, "Viewing a Traffic Summary".
As a safeguard against permanently overloaded systems, RUEI automatically stops processing all Collector log files for the previous day approximately 30 minutes after midnight. This enables any backlog to be discarded, and for RUEI to return normal processing levels.
If the situation shown in Figure C-1 persists, it is strongly recommended that you use network filters to limit the level of monitored traffic. This is fully explained in Section 13.4.3, "Limiting Overall Traffic". You might also consider assigning more resources to the RUEI system.
C.10 Collector Crashes Do Not Generate Core Dumps
In the event of a Collector instance crashing, no core dump is generated. However, some customer issues can only be resolved by Customer Support if a core dump is made available. The procedure to enable core dumps on Collector systems is described in the Oracle Real User Experience Insight Advanced Administrator's Guide.
C.11 Deliberately Forced Core Dumps Reported in Event Log
Thread deadlock detected in the log file processor; forcing a core dump.This may be caused by insufficient system memory.
If the above error appears in the event log, do the following:
-
If this message appears at irregular intervals, this is probably caused by a bug in the RUEI software. You should contact Customer Support with the relevant event details.
-
If this messages appears every (or most) nights, it can indicate an overloaded system where high levels of memory swapping are occurring. In this case, you should consider adding additional memory to the system.
C.12 Memory Allocation Error
The following error is reported in the Event Viewer:
linux.c, 326,cap_dev_set_filter()]: setsockopt(): Cannot allocate memory
The underlying Linux socket interface used by the Collector for monitoring traffic has a memory allocation limit of 20KB. This limit can be exceeded when a large number of network filters (or VLAN definitions) are configured.
This underlying limit can be increased on a running system by issuing the following command as the root user:
/sbin/sysctl -w net.core.optmem_max=65535
In order to make this setting persistent across reboots, add the following line to the /etc/sysctl.conf file:
net.core.optmem_max=65535
C.13 Multiple User Sessions Receiving the Same Cookie Value
As explained in Section 8.2.13, "Defining User Identification", RUEI uses cookies to track user sessions. Be aware that when high numbers of concurrent users visit a monitored website, and a limited selection of unique cookie values are available, this can lead to different user sessions being assigned the same cookie values. If this happens, it can lead to their unpredictable reporting. Therefore, it is strongly recommended that the following cookie and cookie values are not used for session tracking:
-
Load-balancing cookies.
-
Time-based cookies.
-
Log-out cookie values.
-
Cookies in which user preferences are stored (especially if the range of possible values is limited).
-
Cookies that are not set for the full application domain.
Important:
It is strongly recommended that the use of fast-rotating cookie values is avoided for the tracking user sessions.Furthermore, it is recommended that you ensure that the configured cookie technologies cover all monitored hits, and that multiple matching cookies for hits are avoided.
C.14 Recovery of Objects After a Database Crash
In the event of a database crash, objects may become corrupted. Typically, this reveals itself with ORA-00376 and similar errors reported in the Event Log.
Carefully review the information in the Knowledge Base article at the following location:
https://support.us.oracle.com/oip/faces/secure/km/DocumentDisplay.jspx?id=1303180.1
In particular, ensure that the indicated tablespaces are set to force logging.
You can use the following command to view the status of the database tables:
cop stats %period
where period indicates the required year (2012), month (201203), or day (20120326). The command output appears as follows:
STRUCTURE PRESENTATION DATA ROWS DATA SIZE hash data dims lvls pres view data desc data desc cube name------ ---- ---- ---- ---- ---- ------ ------ ------- ------- ----------fTq7vQ 19 11 22 133 156 0 2 0.1 MB 0.1 MB wg_keypage_mo_201203u7q+3g 9 4 8 13 7 - 470 0.6 MB 0.1 MB wg_kpi_mo_201203PMocAw 22 9 17 159 174 - 16960 19.0 MB 4.0 MB wg_page_mo_201203K/p4ww 12 12 29 123 104 0 0 0.1 MB 0.1 MB wg_service_mo_2012031S2Ggg 10 19 29 79 90 - 247 2.0 MB 0.1 MB wg_slowurl_mo_201203lZRuxg 29 5 10 279 61 0 0 0.1 MB 0.1 MB wg_trasta_mo_201203yuY0aQ 29 11 20 153 204 - 343 2.0 MB 0.1 MB wg_visit_mo_201203
Note that if the Data column contains a zero value, or there a large number of zeros or dashes, this would indicate corrupted database tables. In this case, you should use the script described in the following Knowledge Base article to restore the database:
https://support.us.oracle.com/oip/faces/secure/km/DocumentDisplay.jspx?id=556733.1
In addition, it is recommended that you issue the following commands to force an update of the RUEI configuration and template tables:
makedatabase @
modr -fn all