Baird
Baird took inspiration from the delivered search indexes and Kibana visualizations, built custom detailed search indexes and visualizations
Summary
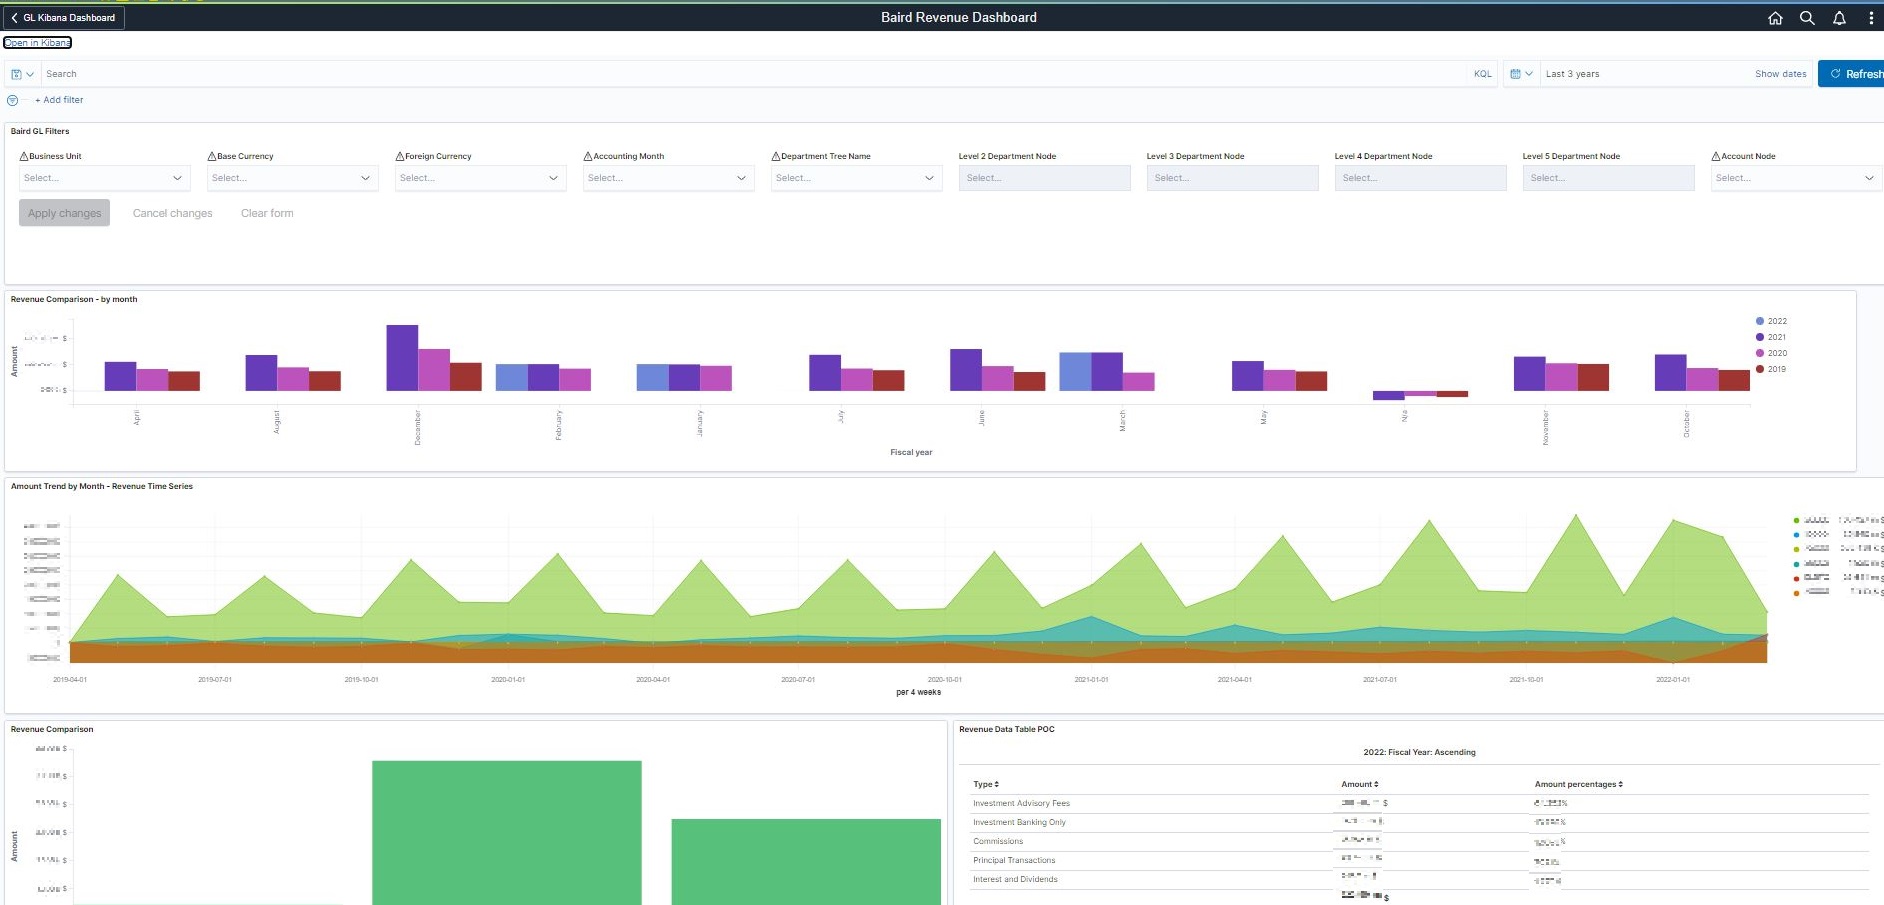
Baird implemented PeopleSoft Kibana. Baird took inspiration from the delivered search indexes and Kibana visualizations, built custom detailed search indexes and visualizations, and then modified the labels on these to suit organizational terminology.
Baird is a great example of what customers can do with search indexes and Kibana beyond what the applications teams deliver. Their implementation is an example for other customers to see the value of how the investment in Kibana and PeopleSoft data can be leveraged into something greater.
Customer comments
Baird took inspiration and ideas from the delivered search indexes and Kibana visualizations. We started building custom detailed search indexes and a lot of visualizations around accounts payable and general ledger data, organizing them into user-friendly dashboards. Then, we modified the labels on these dashboards and visualizations to suit organizational terminology. These dashboards provide leadership, analysts, operational managers, and technical leaders with insights on data to drive better decisions, to improve operational efficiencies (for example, increase days payable), and to plan for opportunities in budgeting.

Here are some use cases we had the opportunity to explore and visualize:
- Invoice entered by the source to identify the percentage of online and manual vouchers entered and find ways to maximize efficiencies and build integrations or consolidate sources to minimize online entry.
- Invoice approval patterns.
- Payment terms of most commonly paid suppliers and top suppliers to find opportunities on pay terms (for example, moving away from due date to net 30).

- Payments count by payment method to find opportunities on moving from system checks to ACH or other payment methods.
- Trends in revenue, expense, and net income by years using time series visualizations.
- Trends in revenue, expense, and net income over time (up to 10 years in the past), breaking it down by month.
- GL operational dashboard to find opportunities in journal approvals and posting, helping the month-end close process.
There are plans to index more data from the project costing, billing, contracts, and accounts receivable modules to build different visualizations to understand trends and capture opportunities in the lead-to-cash process.
See also
Learn more about Baird's rollout of Kibana from this presentation at Quest's BLUEPRINT4D 2022 conference: Deploying Kibana Analytics: A PeopleSoft Customer Success Story (no login required).