The Washington State Board for Community and Technical Colleges
The Washington State Board for Community and Technical Colleges (SBCTC) deployed PeopleSoft Insights for asset management, accounts payable, and travel and expenses
Summary
The Washington State Board for Community and Technical Colleges (SBCTC) deployed PeopleSoft Insights for asset management, accounts payable, and travel and expenses.
In the future, SBCTC plans to extend the use of Insights to billing, contracts, general ledger, payables, project costing, and receivables.
Customer comments
SBCTC advocates, coordinates, and directs Washington state’s system of 34 public community and technical colleges.
Each year, about 290,000 students train for the workforce, prepare to transfer to a university, gain basic math and English skills, or pursue continuing education. Our students, graduates, and community partners increase the state’s quality of life and economic vitality as entrepreneurs, employees, consumers, and taxpayers.
In 2024, SBCTC deployed PeopleSoft Insights in the following areas:
- Asset Management
- CTC Asset Analytics - Helps analyze asset count, cost, depreciation/amortization expense, and net book value based on asset type and category.
- CTC Year Over Year Asset Analytics - Helps analyze year-over-year comparisons of asset disposals, depreciation/amortization expense, and cost versus net book value.
- Accounts Payable (Vouchers)
- CTC Early Detection and Monitoring - To view the liability and payment exposures routed through vouchers.
- CTC Trend Analysis - To view the liability exposure across financial periods by summarized voucher related data.
- Travel and Expense
- CTC Performance and Operations - Analyze the travel and expense activity in a Business Unit by Operating Unit or department.
In the future, SBCTC plans to extend the use of Insights to billing, contracts, general ledger, payables, project costing, and receivables.
CTC asset analytics insights
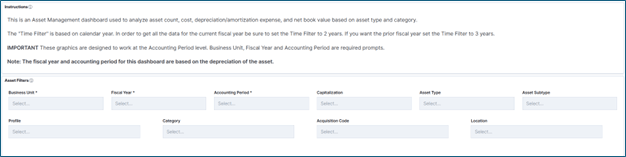
Asset Filters: Filters to refine dashboard data.

Asset Count: Count of total assets for fiscal year and accounting period.
Total Cost: Total asset cost for fiscal year and accounting period.
Life to Date Depreciation: Life to date depreciation for fiscal year and accounting period.
Net Book Value: Total netbook value of your assets for fiscal year and accounting period.

Top 10 Asset Types - Asset Count: Top ten asset types that represent the total asset count.
Top 10 Categories - Asset Cost: The top ten asset categories with the highest asset cost.
CTC year-over-year asset analytics insights
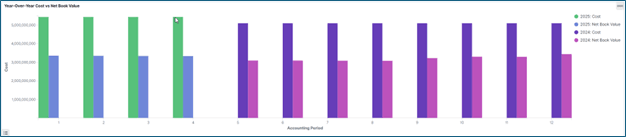
Year-Over-Year Cost vs Net Book Value: Provides a year-over-year comparison of asset cost and net book value by accounting period. The horizontal axis represents the accounting period, and the vertical axis represents asset cost and net book value.
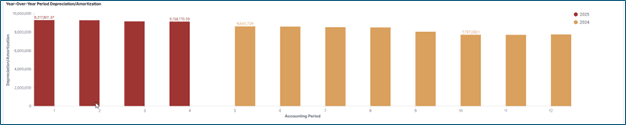
Year-Over-Year Period Depreciation/Amortization: Provides a year-over-year comparison of asset depreciation and amortization by accounting period. The horizontal axis represents the accounting period, and the vertical axis represents the depreciation and amortization amount.
CTC early detection and monitoring insights
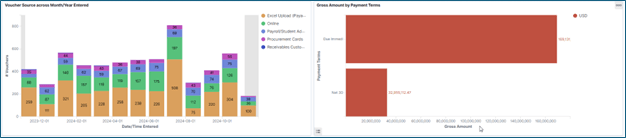
Voucher Source across Month/Year Entered: Shows the number of vouchers by voucher source for a given month/year range.
Gross Amount by Payment Terms: Shows the gross amount by payment terms for a given time range based on the time filter and fiscal year/accounting period (if selected).
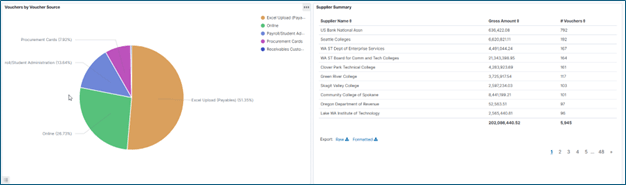
Vouchers by Voucher Source: Like voucher source across month/year entered, managers can view the number of vouchers by source.
Supplier Summary: Displays the top 10 suppliers based on gross amount.
CTC trend analysis insights
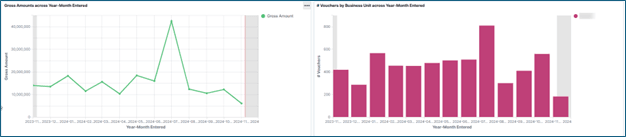
Gross Amounts across Year-Month Entered: Displays the gross number of vouchers over a given period range.
# Vouchers by Business Unit across Year-Month Entered: Displays the total number of vouchers by business unit over a given period range.
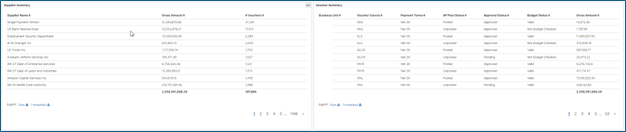
Supplier Summary: Displays gross amount and voucher count for each supplier.
Voucher Summary: Displays gross amount by voucher source, payment terms, AP post status, approval status, and budget status.
CTC performance and operations insights
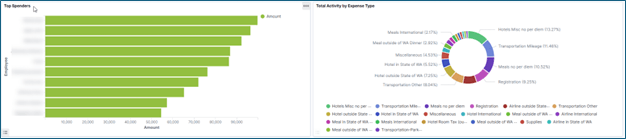
Top Spenders: Shows employees with the highest value expense reports for the reporting timeframe.
Total Activity by Expense Type: Shows the actual spending for various expense types such as airfare, hotels, meals, and more within the reporting timeframe.
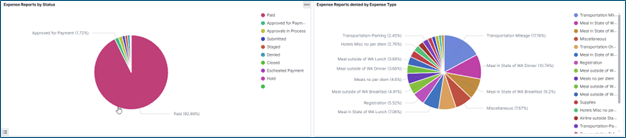
Expense Reports by Status: Shows the percentage of expense reports by status.
Expense Reports denied by Expense Type: Shows the percentage of expense reports denied by expense type.