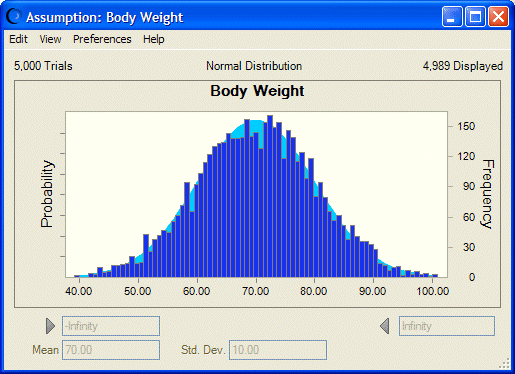
Assumption charts show trial values for a simulation plotted over the ideal probability distribution for that assumption. Assumption charts are created automatically when you run a simulation. They cannot be deleted, only opened or closed (Figure 38, Assumption Chart).
Assumption charts are useful for comparing Run Preferences settings. For example, you can look at charts for the same assumption before and after increasing the number of trials and switching between Monte Carlo and Latin Hypercube sampling. More trials and larger samples usually generate smoother curves that are closer to the ideal distribution. You can add assumption charts to reports or copy them to the clipboard for use in other applications.
