To run the simulation, click Start.  .
.
Crystal Ball runs a simulation for the situation in the Futura Apartments workbook and displays a forecast chart as it calculates the results.
By default, the simulation stops automatically after it has run for 1,000 trials. For larger models, you can use the Stop button,  if you need to stop the simulation before all trials have run.
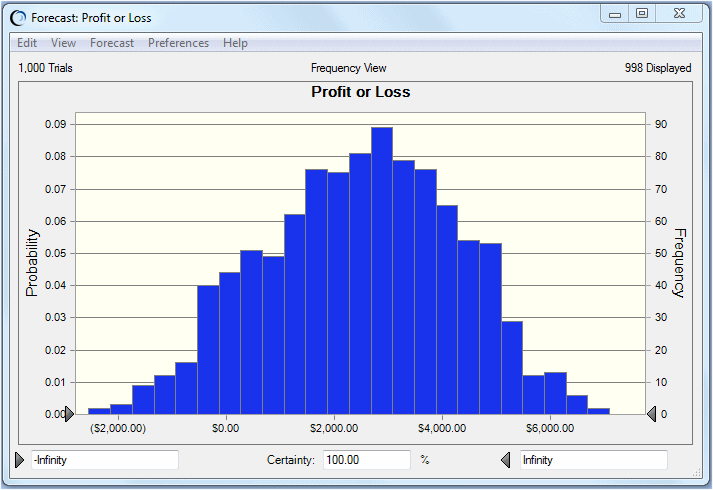
When the simulation stops, the forecast window opens, as in Figure 108, Futura Apartments Profit/Loss Forecast. The numbers will vary slightly each time the simulation is run, but the forecast window should look similar to this illustration.
The forecast chart shows the total range of profit or loss outcomes predicted for the Futura Apartments scenario. Each bar on the chart represents the likelihood, or probability, of earning a given income. The cluster of columns near the center indicates that the most likely income level is between $2000 and $4000 per month. Notice that there is also a small chance of losing almost $2000 per month (the lower-value end of the display range) and a small chance of making about a $7,000 gain.
Notice that the probability, or certainty, of a value falling within the range of negative infinity and positive infinity is 100 percent. Notice too that the chart shows 1000 trials were run but only 998 are displayed. The excluded values, if any, are extreme values that are included in calculations but are not included in the forecast chart.
