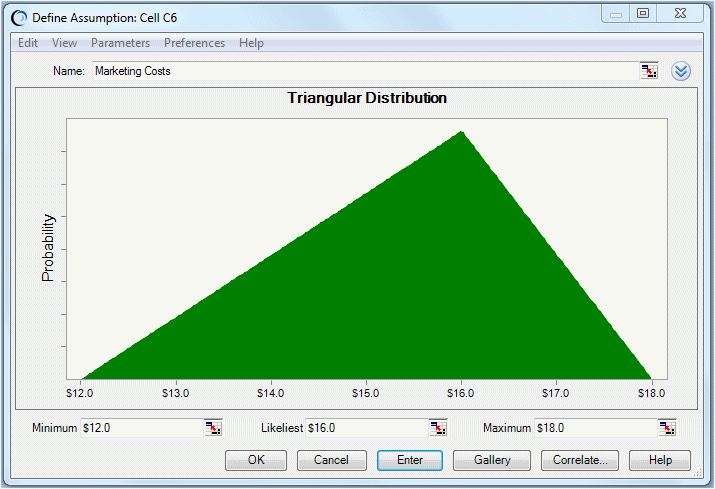
Vision Research plans to spend a sizeable amount marketing ClearView if the FDA approves it. Including sales commissions and advertising costs, Vision Research expects to spend between $12,000,000 and $18,000,000, with a most likely amount of $16,000,000.
Vision Research selects the triangular distribution to describe marketing costs because the triangular distribution describes a situation where you can estimate the minimum, maximum, and most likely values to occur. This assumption is already defined for you.
 To examine the assumption cell for marketing costs:
The Triangular Distribution dialog (Figure 115, Triangular Distribution for Cell C6) opens for cell C6.
The triangular distribution has three parameters — Minimum ($12 million), Likeliest ($16 million), and Maximum ($18 million).
When you run the simulation, Crystal Ball generates random values that fall around 16, with fewer values near 12 and 18.
 .
.