For FDA approval of ClearView, Vision Research must conduct a controlled test on a sample of 100 patients for one year. Vision Research expects that the FDA will grant an approval if 20% or more of the patients tested are cured (show corrected vision) after taking ClearView for one year. Vision Research is encouraged by their preliminary testing, which shows a success rate of around 25%.
Vision Research selects the binomial distribution to describe the uncertainties in this situation because the binomial distribution describes the random number of successes (25) in a fixed number of trials (100).
This assumption is already defined.
 To examine the assumption cell for patients cured, use the following steps:
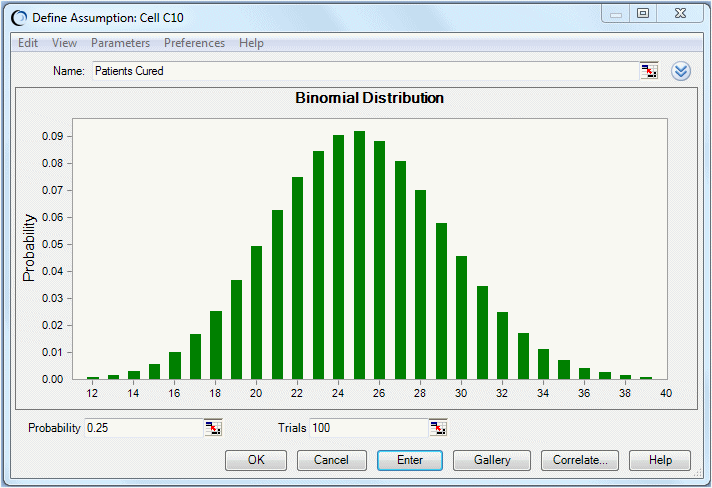
The Binomial Distribution dialog opens as shown in Figure 116, Binomial Distribution Dialog.
The binomial distribution has two parameters: Probability and Trials. Because Vision Research experienced a 25% success rate during preliminary testing, the Probability parameter is set to 0.25 to show the likelihood of success.
You can express probabilities either as decimals between 0 and 1, such as 0.03, or as whole numbers followed by the percent sign, such as 3%.
Because the FDA expects Vision Research to test 100 people, the Trials parameter is set to 100. When you run the simulation, Crystal Ball generates random integers between 0 and 100, simulating the number of patients that would be cured in the FDA test.
 .
.