Now that you have run the simulation, you are ready to interpret the forecast results. Should Vision Research scrap the ClearView project or proceed to develop and market this revolutionary new drug? For the answer, review the forecast charts.
The following sections describe how to analyze results for this scenario:
Crystal Ball windows are separate from Microsoft Excel windows. If Crystal Ball’s windows or charts disappear from the screen, they usually are behind the main Microsoft Excel window. To bring them to the front, click the Crystal Ball icon in the Windows taskbar or press Alt+Tab and select Crystal Ball, |
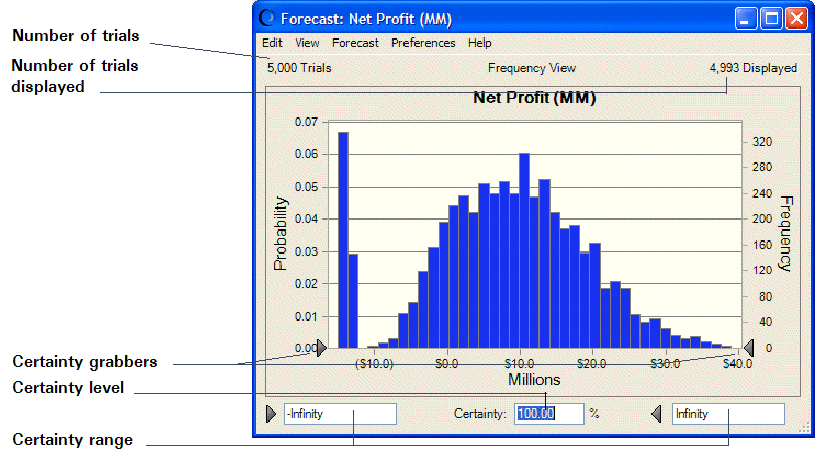
Forecast charts are frequency distributions. They show the number or frequency of values occurring in a given bin or group interval and show how the frequencies are distributed. In Figure 124, Net Profit Forecast, the bin that contains the most values has a frequency of about 280.
Crystal Ball forecasts the entire range of results for the Vision Research project. However, the forecast charts do not display the most extreme values. Here, the display range includes values from approximately –$15 million to $38 million.
The forecast chart also shows the certainty range for the forecast. By default, the certainty range includes all values from negative infinity to positive infinity.
Crystal Ball compares the number of values in the certainty range with the number of values in the entire range to calculate the certainty level.
The previous example shows a certainty level of 100%, since the initial certainty range includes all possible values. Remember that the certainty level is an approximation, since a simulation can only approximate the elements of the real world.
The Vision Research president wants to know how certain Vision Research can be of achieving a profit and what are the chances of a loss.
Analyzing the Net Profit forecast chart again (Figure 125, Net Profit Forecast—$0 Minimum), you can see that the value range between the certainty grabbers shows a certainty level of about 79%. That means that Vision Research can be 79% certain of achieving a net profit. You can therefore calculate a 21% chance of suffering a net loss (100% minus 79%).
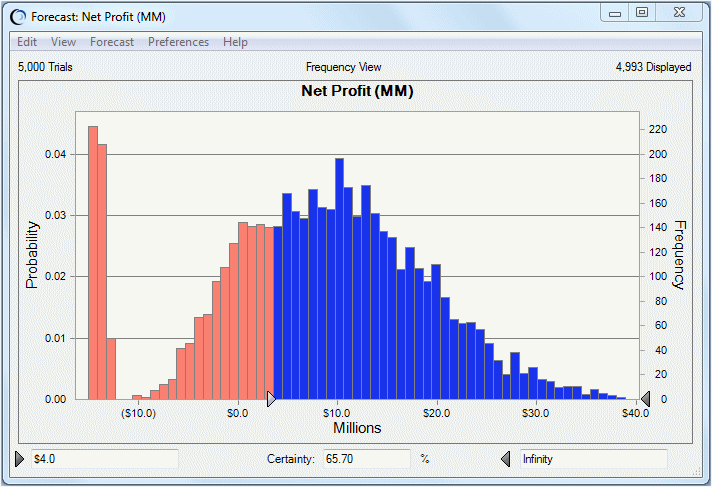
Now, the president of Vision Research would like to know the certainty of achieving a minimum profit of $4,000,000. If Crystal Ball shows that Vision Research can be at least two-thirds certain of a $4,000,000 net profit, the president is ready to go ahead with the ClearView project.
The Net Profit forecast chart in Figure 126, Net Profit Forecast—$4.0 Million Minimum shows a certainty level of almost 66%. With virtually two-thirds certainty of a minimum net profit of $4,000,000, Vision Research decides to go ahead with the ClearView project and proceed to develop and market this revolutionary new drug.
Crystal Ball charts are useful for presenting results as well as analyzing them. A variety of chart preferences are available to show different chart views, types, colors, and more.
To display the chart preferences, select Preferences, and then Chart in the forecast chart window.
You can also use keyboard shortcuts to customize the appearance of charts without using the Chart Preferences dialog.
 Select a forecast chart and try these shortcuts now:
Press Ctrl+t to cycle through chart types (area, line, and column).
Press Ctrl+d to change the chart views (frequency, cumulative frequency, reverse cumulative frequency).
Press Ctrl+m to cycle through a series of markers that show the mean and other measures of central tendency.
Press Ctrl+p to cycle through a series of percentile markers.
Press Ctrl+b to change the density of the chart by varying the number of bins.
Drag the edges of the chart window until the proportions and size suit the presentation plans.
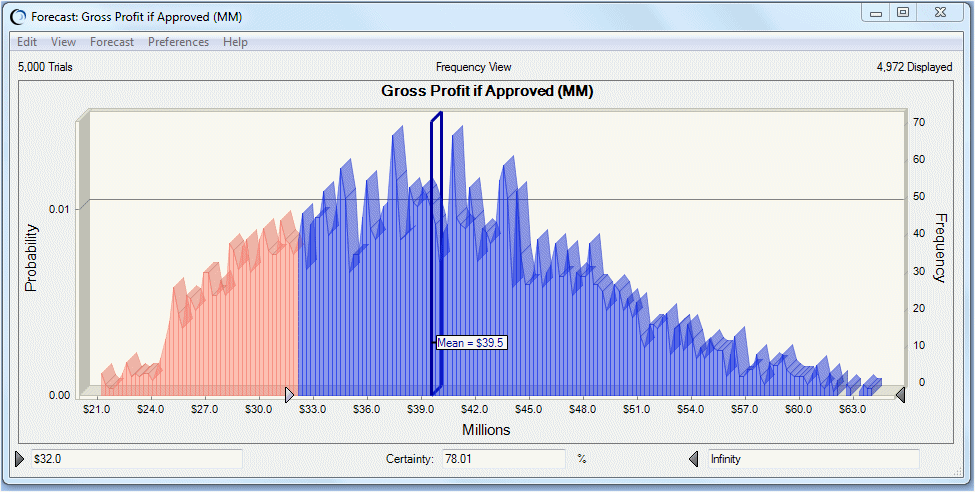
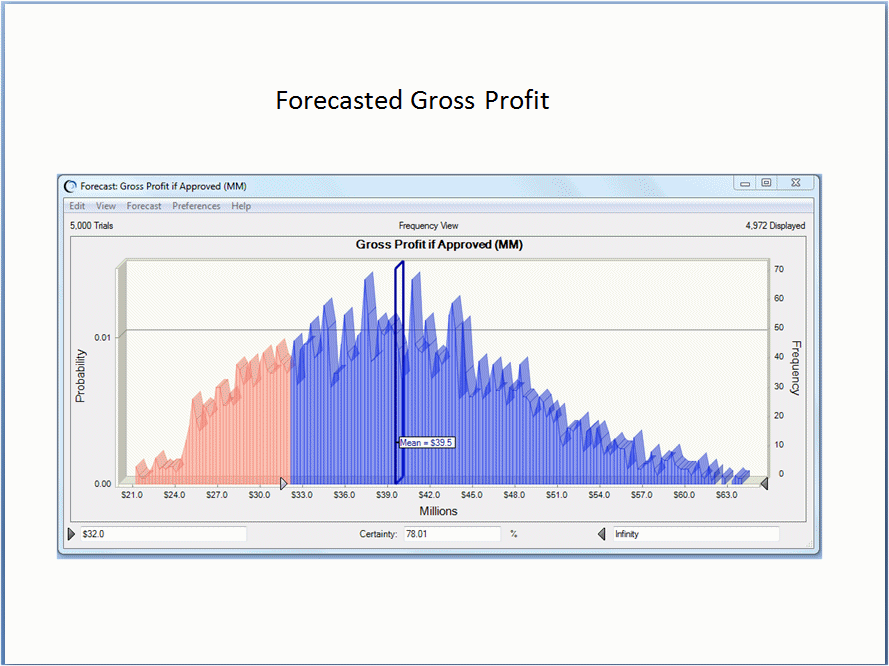
For example, Figure 127, Customized Gross Profit Chart shows the ClearView gross profit forecast presented as a 3-D area chart with a mean marker, stretched to show more detail in the x-axis. The chart is also set for 50% transparency. The Certainty text boxes have been set to show that the certainty of a gross profit greater than $32 million is about 78%.
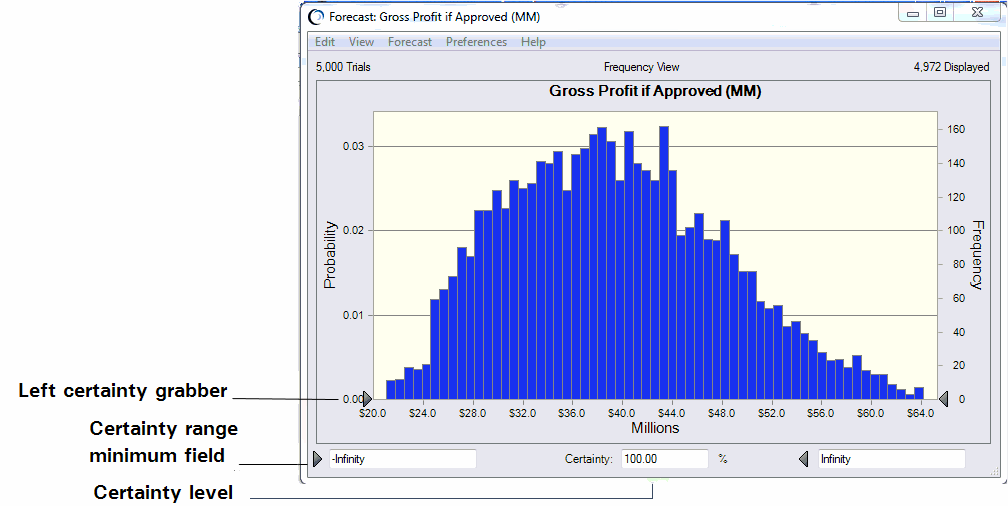
You can select Edit, then Copy Chart in the chart menu bar to copy a chart to the clipboard for pasting into Microsoft Excel or another application. Figure 128, Gross Profit Chart Pasted into a Presentation Slide shows the ClearView gross profit chart pasted into a presentation slide.
