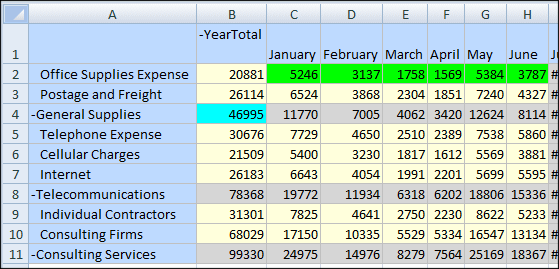
Figure 133, Smart View Worksheet with Crystal Ball EPM Assumptions Defined on Planning Data shows a Planning form in Smart View. This example defines monthly office supplies expenses as Crystal Ball EPM assumptions. When added to postage and freight expenses, monthly and yearly totals are calculated. Crystal Ball assumptions are defined for January through May. Ther Define Assumption dialog shows the assumption that is defined for June — a normal distribution with mean equal to the original Planning value and a standard deviation equal to 10 percent of the mean.
A Crystal Ball EPM forecast is defined on cell B4, Yearly total for general supplies (Figure 134, A Crystal Ball EPM Forecast Is Defined on the Yearly Total for General Supplies). This worksheet includes no formulas. Totals are calculated from Planning calculation definitions when a Crystal Ball EPM simulation runs.
At the beginning of the simulation, Crystal Ball EPM temporarily stores current data values for all assumption cells. Then, while the simulation is running, Crystal Ball EPM generates values for the assumption cells and submits them to Planning. The values returned in the forecast cells are saved for analysis and reporting. When the simulation ends, Crystal Ball EPM restores the original values in the worksheet.
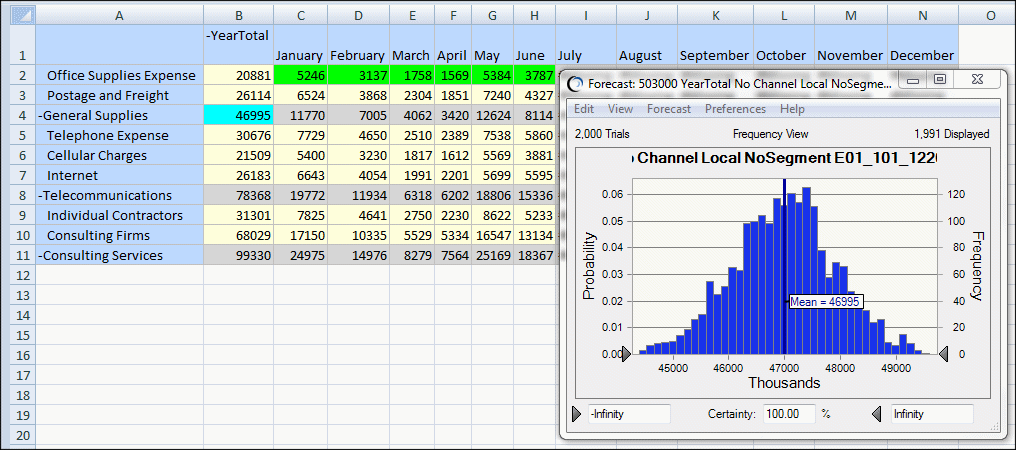
Figure 135, Simulation Results Shown in a Forecast Chart shows a forecast chart, a bar graph of values returned in 2,000 simulation trials. The mean is the same as the original Oracle Hyperion Planning value in cell B4, but the graph shows that a range of values was generated by the simulation.
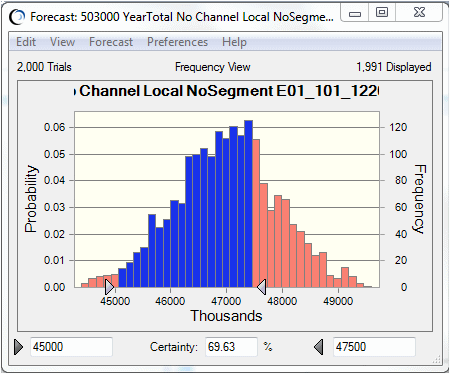
Figure 136, The Probability of a Certain Total General Supplies Expense shows the probability, or certainty, that the currrent total expense for General Supplies will fall between $45,000 (thousands) and $47,500, based on values for January through June. The answer is approximately 70%


