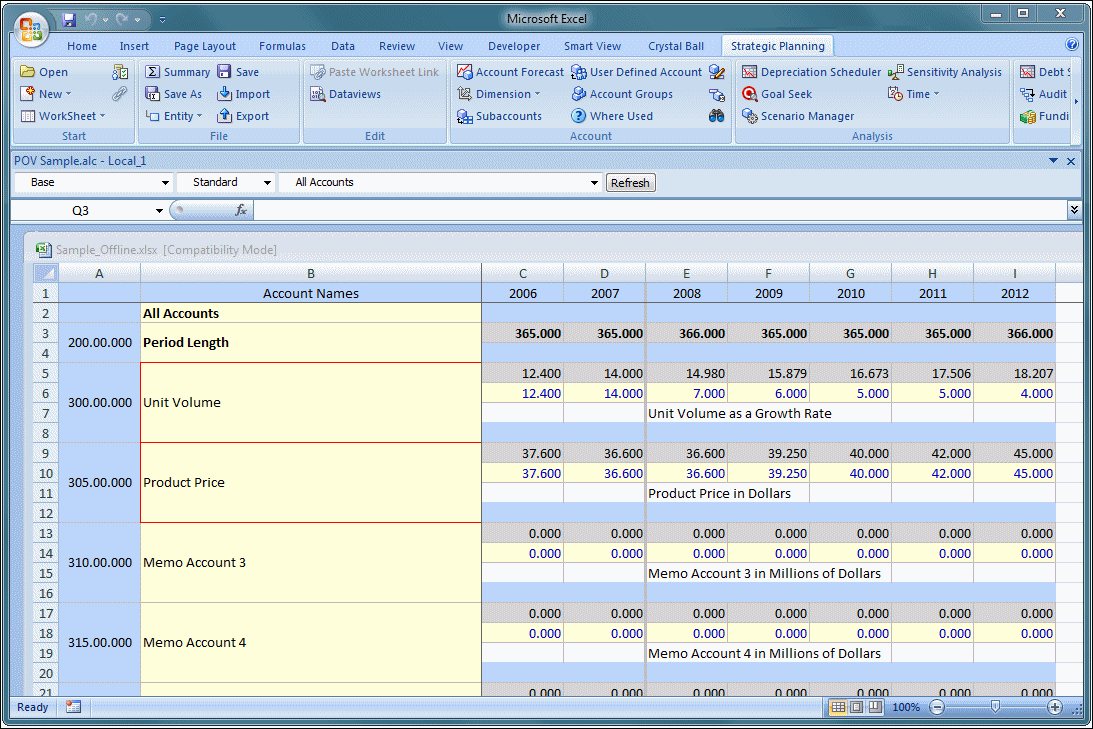
For this example, suppose that you select a Strategic Finance server in the Shared Connections area of the Smart View panel. When the connection is complete, you click the ribbon labeled Strategic Planning, and then click Open. Next, you open a Strategic Finance file, in this case, Sample.alc. The POV is set to Base, Standard, and All Accounts (Figure 137, Strategic Finance File, Sample.alc, Opened in Strategic Finance).
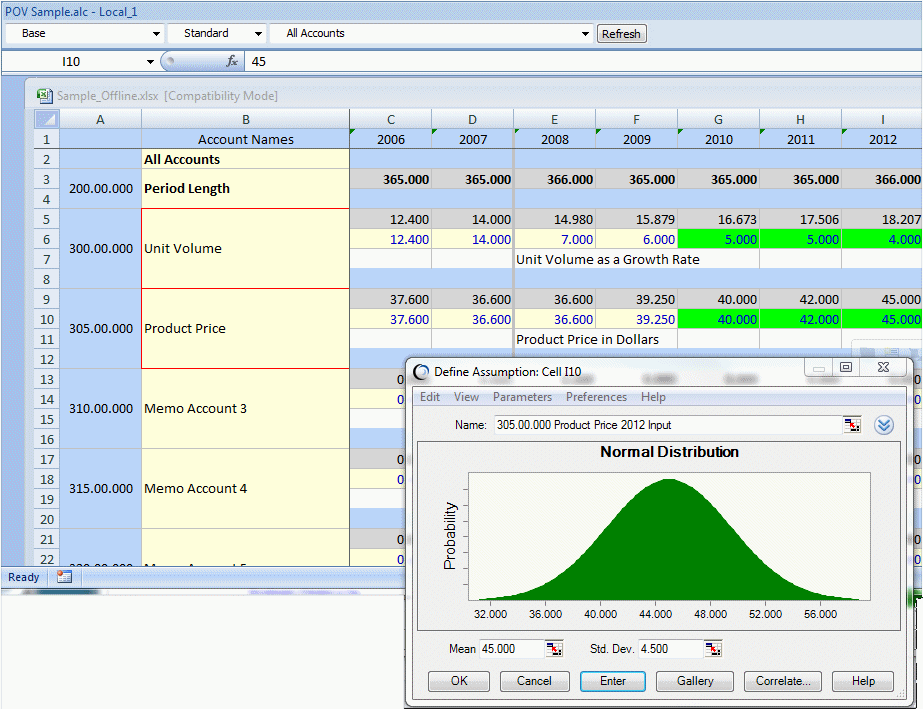
You decide to analyze some data for the years 2010, 2011, and 2012. You define Unit Volume, Product Price, and Cost of Goods Sold as Crystal Ball EPM assumptions using the normal distribution and default mean and standard deviation. These are defined in the input row for each account (Figure 138, Defining Strategic Finance Input Cells as Crystal Ball EPM Assumptions). The mean is the original cell value and the standard deviation is a tenth of that value. As the simulation proceeds, a range of values are generated in agreement with the assumption definitions.
Note: | Although this example uses the normal distribution, you may want to select another distribution that is more appropriate for your data, or use the triangular distribution since it suits a variety of situations. |
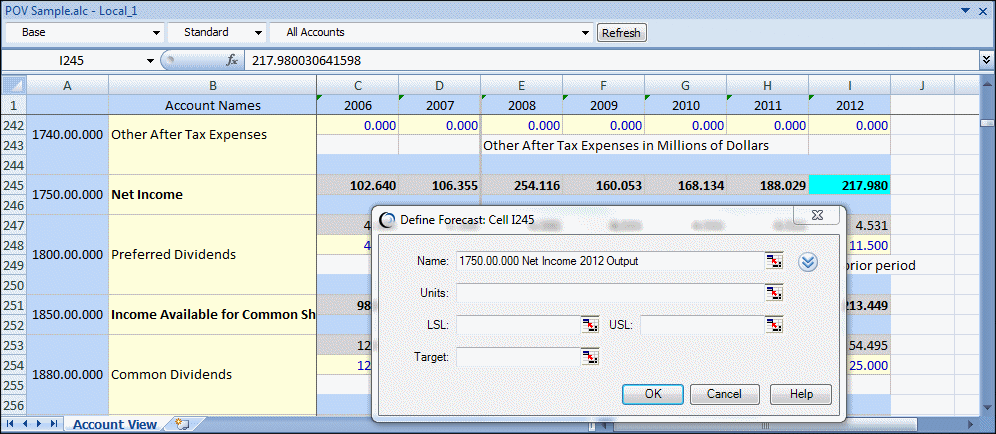
Because you are only interested in Net Income for the year 2012, you select the output cell for 2012 Net Income and define it as a Crystal Ball EPM forecast (Figure 139, The Net Income Output Cell for 2012 Defined as a Crystal Ball EPM Forecast). The forecast calculation works because Strategic Finance business logic attached to the output cell uses data from at least some of the input cells defined as Crystal Ball EPM assumptions.
The Crystal Ball EPM data cells are now defined. The assumption cells are green and the forecast cell is blue. If you are unable to distinguish these two colors, you can use the Crystal Ball EPM cell preferences to change the colors or use patterns instead.
Now you can run a simulation against the model.
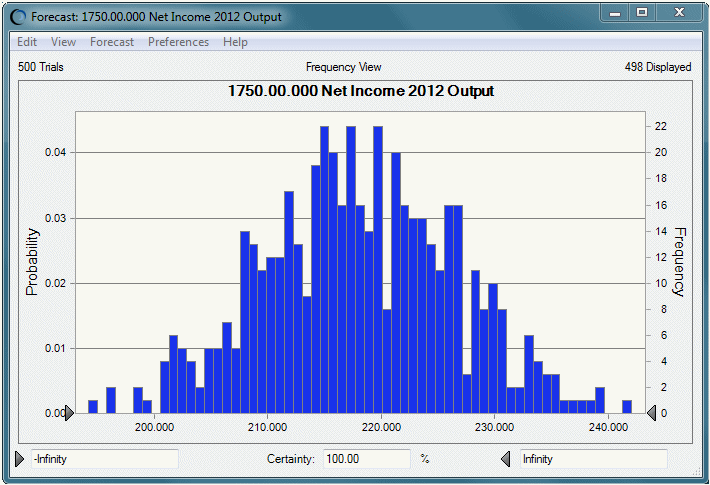
You run 500 trials. A forecast chart is displayed for 2012 Net Income (Figure 140, Crystal Ball Forecast Chart for 2012 Net Income).
You type different values into the certainty fields of the forecast chart to explore the probability of different events occurring.
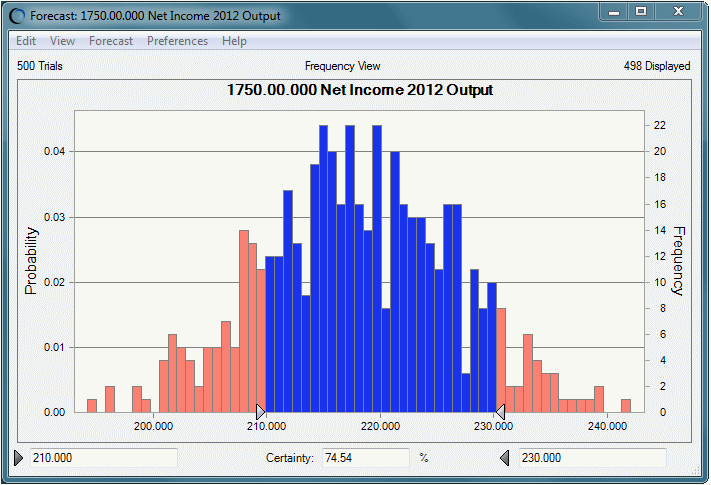
The probability of earning Net Income between 210 and 230 million dollars is about 75% (Figure 141, Forecast Chart for the Middle 75% of 2012 Net Income).
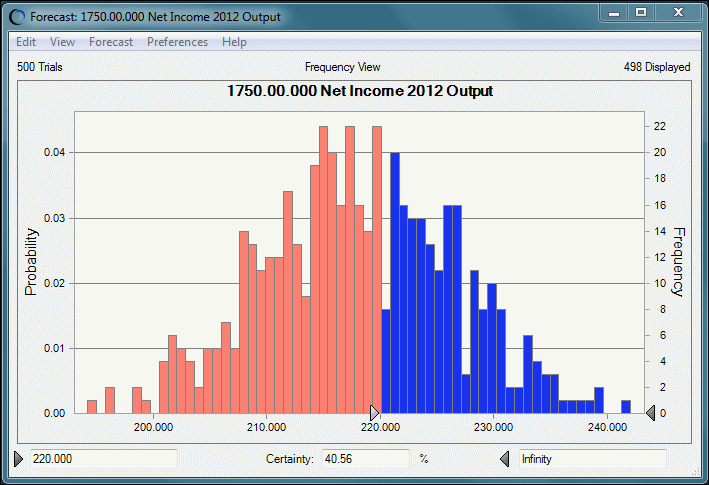
You determine that the probability of earning Net Income greater than 200 million dollars is about 40% (Figure 142, Forecast Chart for 2012 Net Income Greater than $200 Million).
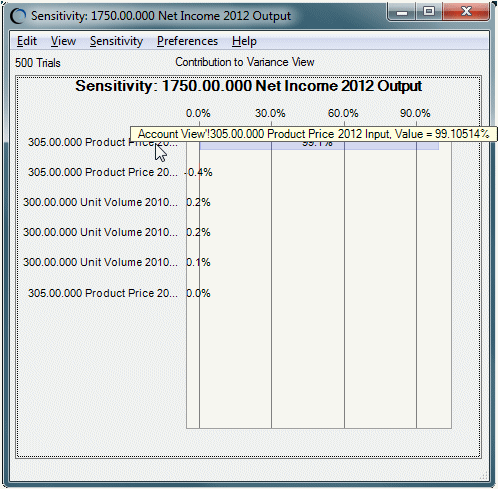
Finally, you return the forecast chart to its original form and select Forecast, and then Open Sensitivity Chart to generate a sensitivity chart of all defined assumptions against the 2012 Net Income forecast (Figure 143, Sensitivity Chart for 2012 Net Income). You see that 2012 Cost of Goods is responsible for about 99% of the variance in 2012 Net Income. You decide to focus efforts on reducing those costs.
