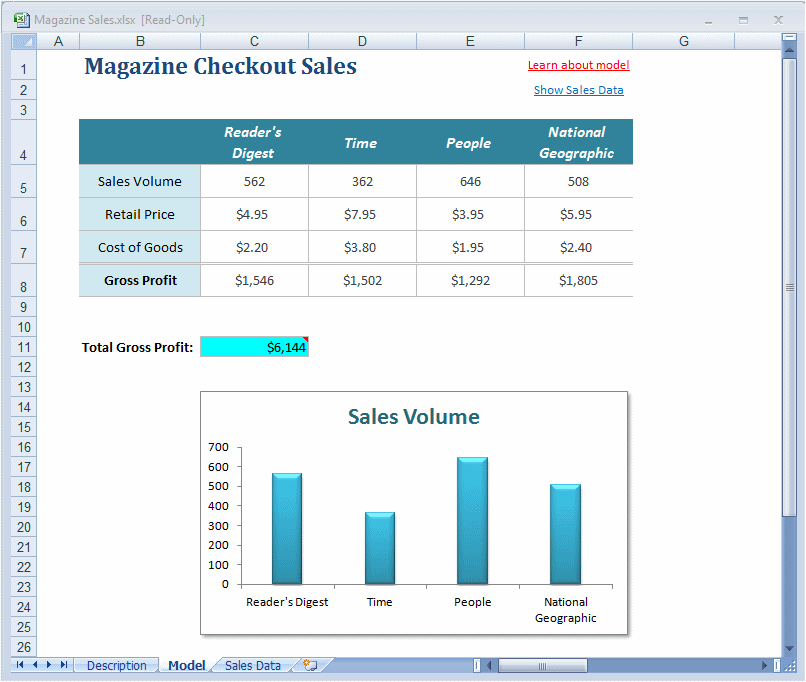
The Batch Fit tool analysis example uses a Crystal Ball example model, Magazine Sales.xlsx. This model (Figure 49, Magazine Sales Workbook) shows the estimated gross profit resulting from newsstand sales of four of the company’s most popular magazines.
In this model, cells C5 through F5 are formulas that refer to the first row of data on the Sales Data worksheet. However, the model would be more accurate if these formulas were replaced with assumptions based on the entire range of historical data. The Batch Fit tool can be used to generate an assumption for each data column of the Sales Data worksheet. Then, Crystal Ball commands can be used to copy and paste those assumptions from the output data to the first data row of the Magazine Sales model.
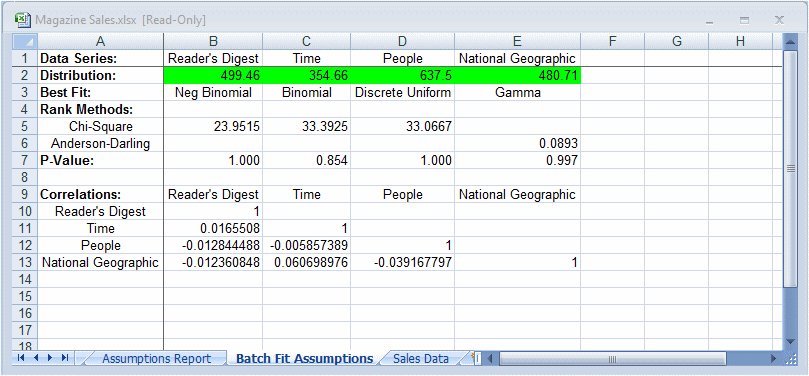
Figure 50, Batch Fit Results for Magazine Sales.xlsx shows assumptions and correlations generated by the Batch Fit tool using data on the Sales Data tab of Magazine Sales.xlsx. When the Batch Fit tool runs, it fits each column of data to each selected distribution. For each fit of a distribution to a set of data, the tool calculates the indicated goodness-of-fit test statistic. The distribution with the best fit is placed in the spreadsheet to create an assumption cell that you can copy to the appropriate location in the model.
The Batch Fit tool was set to use all continuous data for curve fitting, to automatically select a ranking method, to define correlations between all assumptions, to show a correlation matrix between all data series, and to place output on a new Batch Fit Assumptions tab.
In this example, the generated assumptions in row 2 of the Batch Fit Assumptions tab are copied into row 5 of the Model tab using Crystal Ball Copy and Paste commands. The forecast in cell C11 indirectly references all of these Sales Volume assumptions. Then, a Monte Carlo simulation is run, using the same sequence of random numbers with a seed value of 999.
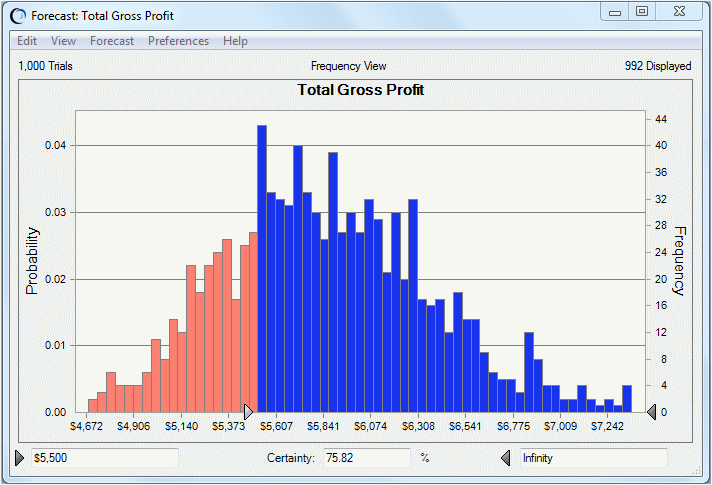
Running the simulation produces a forecast chart of the total gross profit from the Magazine Sales workbook. In the Total Gross Profit forecast chart, if you replace –Infinity with $5,500, you find that the certainty or probability of making this amount of profit is about 75% (Figure 51, Magazine Sales Profit from Newsstand Sales).


