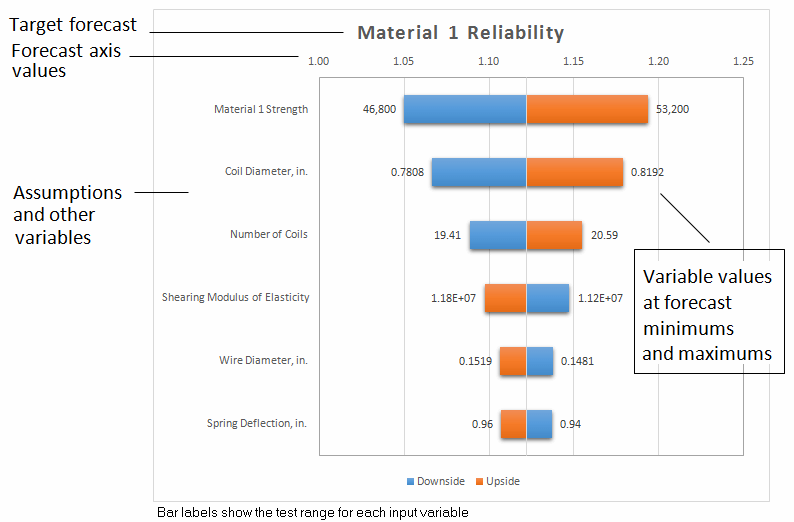
The Tornado Analysis tool tests the range of each variable at percentiles you specify and then calculates the value of the forecast at each point. The tornado chart (Figure 52, Tornado Chart) illustrates the swing between the maximum and minimum forecast values for each variable. The variable that causes the largest swing is displayed at the top and the variable that causes the smallest swing is displayed at the bottom. The upper variables have the most effect on the forecast, and the lower variables have the least effect on the forecast.
The bars next to each variable represent the forecast value range across the variable tested, as discussed previously. Next to the bars are the values of the variables that produced the greatest swing in the forecast values. The bar colors indicate the direction of the relationship between the variables and the forecast.
For variables that have a positive effect on the forecast, the upside of the variable (shown in blue) is to the right of the base case (the initial value in the cell before running the simulation) and the downside of the variable (shown in red) is to the left side of the base case. For variables that have a reverse relationship with the forecast, the bars are reversed.
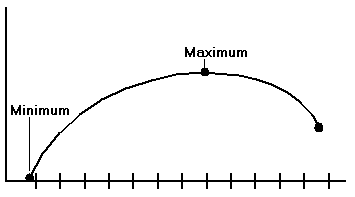
When a variable’s relationship with the forecast is not strictly increasing or decreasing, it is called non-monotonic. In other words, if the minimum or maximum values of the forecast range do not occur at the extreme endpoints of the testing range for the variable, the variable has a non-monotonic relationship with the forecast (Figure 53, A Non-monotonic Variable).
If a variable is non-monotonic, an asterisk (*) is displayed before that variable name in the chart and data table.

