The following Scenario Analysis example uses the Crystal Ball example mode, Toxic Waste Site.xlsx. This model predicts cancer risk to a nearby population from a toxic waste site. This model has four assumptions and one forecast (Figure 63, Toxic Waste Site Spreadsheet Model).
To generate results, the Scenario Analysis tool is run with Risk Assessment as the target forecast and the following Options settings:
Range of forecast results = a percentile range from 95 to 100 percent
While running = Show only target forecast
Simulation control = 1000 as the maximum number of trials to run
Scenario Analysis creates a table of all the forecast values within the specified range, along with the corresponding value of each assumption (Figure 64, Scenario Analysis Results for Toxic Waste Site).
In this example, the simulation generated 1,000 forecast values. Since you selected to analyze the percentiles from 95 to 100, the resulting table lists 51 forecast values, or the top 5% of the forecast range, including the endpoints. The table sorts the forecast values from lowest to highest value along with the assumption values that Crystal Ball generated for each trial.
One way to analyze the Scenario Analysis results is to identify a particular forecast value and see what assumption values created that forecast value.
 To analyze the 98th percentile:
Select the row with the 98.00% (assuming percentile display is set to the defaults, Probability below a value and 10%, 90%, etc.).
Click Paste Selected Scenario.
The scenario of assumption values that produced the 98th percentile value of the target forecast is displayed in the Toxic Waste workbook. Crystal Ball recalculates the workbook and updates the forecast cells.
In the workbook, the assumption and forecast values change to the values for the next scenario (for 98.10%).
The original assumption and forecast values are displayed in the workbook.
Note: | If you have stochastic elements in the model other than Crystal Ball assumptions—for example a RAND() function, a random value returned by a macro, or even a Crystal Ball probability spreadsheet function such as CB.Normal(), the value for that stochastic element is not pasted into the model with the Paste buttons on the Scenario Analysis tool's output spreadsheet. True scenario analysis cannot be performed in this case; if the target forecast is a function of these other elements, the forecast values do not match. |
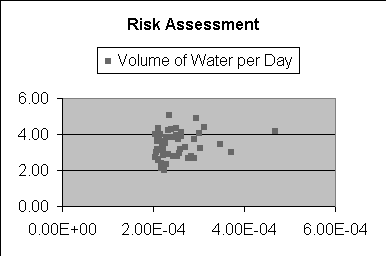
Another way to analyze the Scenario Analysis results is to generate a scatter chart in Microsoft Excel with the data. For example, you can create a scatter chart comparing the risk assessment with the Cancer Potency Factor (CPF) (Figure 65, Scatter Chart of Risk Assessment and CPF).