This example describes a special feature in the Custom Distribution dialog: the Load Data button, which pulls numbers from a specified cell range (grouped data) on the worksheet.
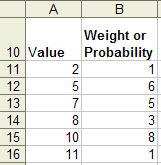
In this example, a company wants to create a custom distribution with six values. Because each value has a different probability of occurring, the values are described as “weighted”. The data is arranged in a two-column table in Microsoft Excel (Figure 94, Single Values with Different Probabilities (Weighted Values)). The first column contains values and the second column contains the probability (weight) for each value.
Note: | Blank probabilities are interpreted as a relative probability of 1.0. Values with zero probability should be explictly entered with a probability of 0.0. |
 To create a custom distribution by loading this data:
In the Define Assumption dialog, select Parameters, and then Weighted Values.
Click the More button beside the Name text box.
The Custom Distribution dialog expands to include a two-column data table.
Since the values are already on the worksheet, you can click Load Data to enter them into the Custom Distribution dialog.
The Load Data dialog opens.
The default settings are appropriate for most purposes, but the following other options are available:
When loading unlinked data, you can choose to replace the current distribution with the new data or append new data to the existing distribution.
If probabilities are entered cumulatively into the spreadsheet you are loading, select Probabilities are cumulative. Then, Crystal Ball determines the probabilities for each range by subtracting the previous probability from the one entered for the current range. You can select View, and then Cumulative Probability to display the data cumulatively in the assumption chart.
Enter a location range for the data, in this case A1:B16. If the range has a name, you can enter the name preceded by an = sign.
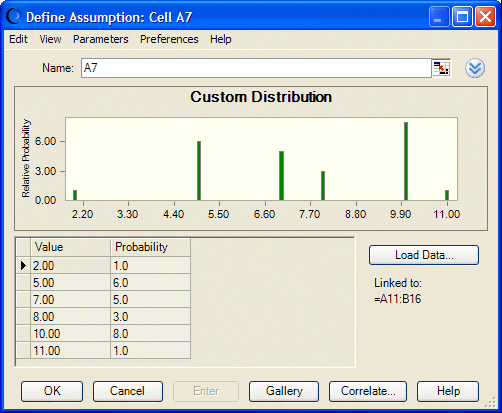
Crystal Ball enters the values from the specified range into the custom distribution and plots the specified ranges, as shown in Figure 95, Weighted Values Loaded in a Custom Distribution.
For more information about entering tables of data into custom distributions, see Custom Distribution Example 2 — Loading Mixed Data and the probability distribution information in the Oracle Crystal Ball Reference and Examples Guide.

